སྒྱུ་རྩལ
མཛེས་སྡུག་དང་བདེ་ཐང
བཟོ་རིག
རིག་གནས་དང་ལོ་རྒྱུས
དགའ་སྟོན
ཁོར་ཡུག
ཟས་དང་བཏུང་རྫས
ཕྱིར་འཕྲུལ་རིག
ཚན་རིག
རྩེད་འགྲན
རིག་རྩལ
གྱོན་རུང
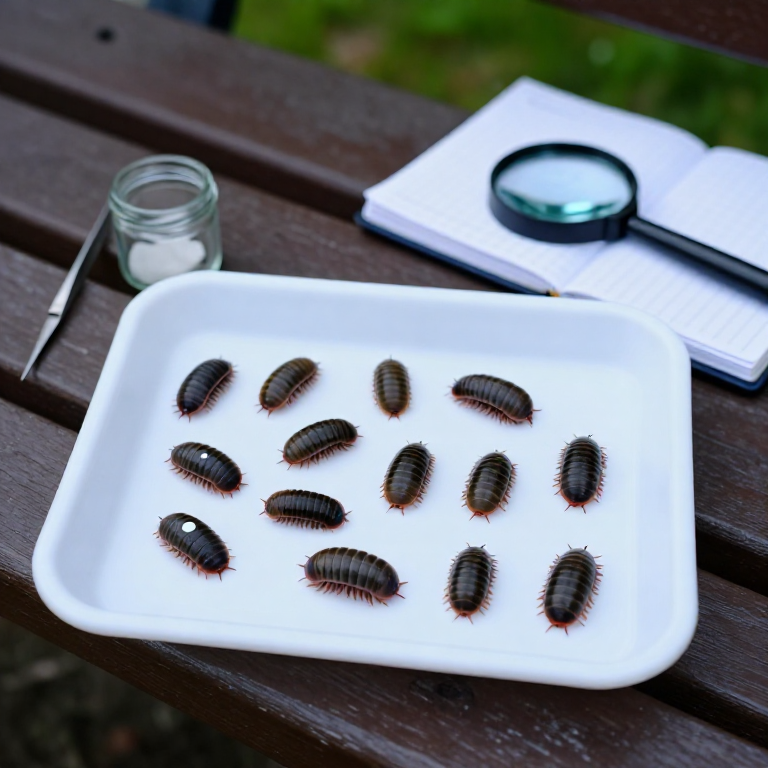


Mark and Recapture: Counting Animals You Cannot See at Once
A quadrat works because plants stay put. Animals move, hide and flee, so you can never see all of them at once — and counting the ones you do see tells you more about your own searching than about the population.
Pierre-Simon Laplace used the idea to estimate the population of France in 1802, and C. G. Johannes Petersen applied it to fish in 1896. Catch a sample, mark them, release them, wait, catch a second sample. If a tenth of the second catch carries marks, then your marked animals are about a tenth of the population — so the population is about ten times the number you marked.
The arithmetic is trivial. The assumptions are not, and every one of them can be violated in a way that makes the answer confidently wrong. Most of this blueprint is about those assumptions, because that is where the real work is.
བར་མ
3 days
ལམ་སྟོན
1
1
Choose a species and a mark that does no harm
Choose a species and a mark that does no harm
Woodlice, snails and ground beetles are ideal: abundant, harmless, easy to catch and easy to mark. Use a tiny dot of non-toxic paint or correction fluid on a hard shell or elytron, never on soft skin, and never anywhere that impedes movement.
The mark must not make the animal more visible to predators, heavier, or less able to hide — if it does, marked animals die faster and your estimate inflates. Work quickly, keep animals cool and shaded, and release them exactly where they were found.
གོམ་པ་འདིའི་རྫས་རིགས:
 ཤེལ་སྣོད།6 དུམ་བུ།
 རྟག་བརྟན་གྱི་སྨྱུ་གུ1 དུམ་བུ།
ལག་ཆས་དགོས་མཁོ:
 རྩེ་བཟུང་།
 ཆེ་བཟོའི་ཤེལ་སྒོར།
 ནའི་ཊི་རཱིལ་གྱི་ལག་ཤུབས།
2
2
Define the area, and keep it the same
Define the area, and keep it the same
Mark out a fixed study area and search it the same way, for the same length of time, on both occasions.
The method estimates the population of an AREA, and if the second search covers more ground or more time than the first, the comparison is broken. Searching under exactly the same set of logs and stones both times is the easiest way to keep effort constant — and note that it also makes the animals living under those logs more likely to be caught twice, which is the next problem.
གོམ་པ་འདིའི་རྫས་རིགས:
 ཤིང་གི་ཕུར་པ་ཆེན་མོ4 དུམ་བུ།
ལག་ཆས་དགོས་མཁོ:
 འཇལ་ཐག
 ཆུ་ཚོད་བཀག་ཆས།
3
3
Leave a gap: long enough to mix, short enough to matter
Leave a gap: long enough to mix, short enough to matter
Release the marked animals and wait — usually a day or two for invertebrates — before the second sample.
Too short and the marked animals have not mixed back into the population, so you recapture them near where you released them and over-count the marked fraction, which UNDER-estimates the population. Too long and animals are born, die or wander out, which breaks the assumption that the population is closed. That tension has no perfect answer and choosing the gap thoughtfully is the skill.
ལག་ཆས་དགོས་མཁོ:
 ཞིང་ཁའི་ཟིན་དེབ།
4
4
Take the second sample without favouring marked animals
Take the second sample without favouring marked animals
Search as before and record how many you caught in total and how many of those carry marks.
The subtle trap is your own eye: once you know what a marked woodlouse looks like, you spot them more readily, and every extra one you notice pushes the estimate down. Collect everything into a container FIRST and only inspect for marks afterwards, indoors, one at a time. That one change removes the bias entirely.
གོམ་པ་འདིའི་རྫས་རིགས:
ཤེལ་སྣོད།6 དུམ་བུ།ལག་ཆས་དགོས་མཁོ:
ཆེ་བཟོའི་ཤེལ་སྒོར།ཞིང་ཁའི་ཟིན་དེབ།5
5
The estimate, the correction and the confidence interval
The estimate, the correction and the confidence interval
Jupyter ཚང་དེབ་མངོན་གསལ་འབད་དོ་…
ལག་ཆས་དགོས་མཁོ:
ཞིང་ཁའི་ཟིན་དེབ།6
6
Release everything, and say what you assumed
Release everything, and say what you assumed
Return every animal to where it was caught, and write in your notes which assumptions you think held and which you doubt.
'Estimated 480, 95% interval 330 to 630, but the gap was only 24 hours so mixing may have been incomplete and the true figure is probably higher' is a useful result. A bare number is not. Stating your doubts is not weakness — it is the difference between a measurement and a claim.
ལག་ཆས་དགོས་མཁོ:
ཞིང་ཁའི་ཟིན་དེབ།རྫས་རིགས
3- 6 དུམ་བུ།ས་ཆ་འཛིན
- 1 དུམ་བུ།ས་ཆ་འཛིན
- 4 དུམ་བུ།ས་ཆ་འཛིན
འབྲེལ་ཡོད་བིལུ་པིརིན་ཊི
བིལུ་པིརིན་ཊི་འདི་ཚུ་ཐབས་ལམ་དང་རྫས་རིགས། སྤྱི་ཆོས་བགོ་བཤའ་བྱེད
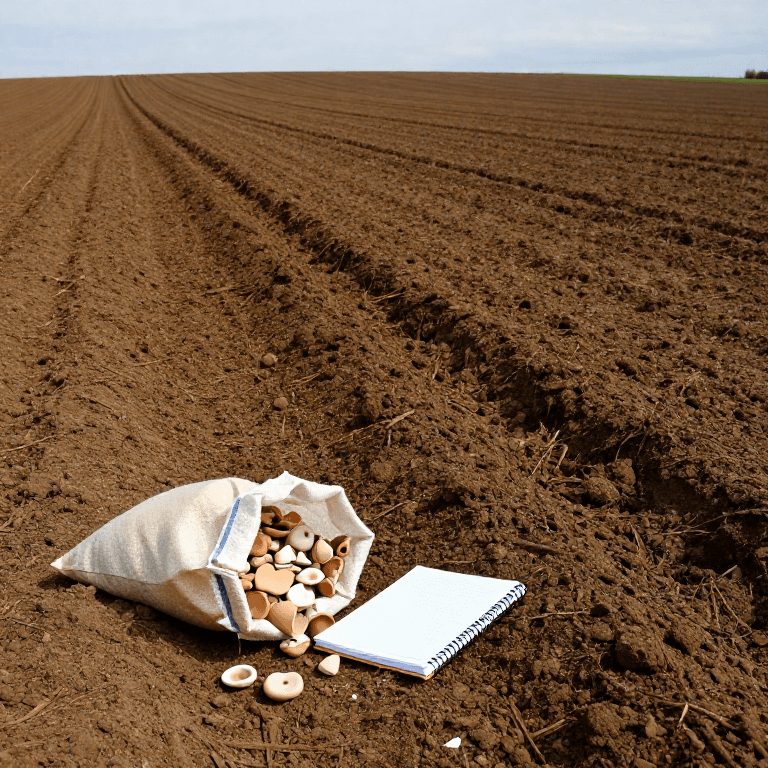



CC0 སྤྱི་དབང
བིལུ་པིརིན་ཊི་འདི་CC0 འོག་བཀྲམས་ཡོད། ཁྱེད་རང་གིས་ཆོག་མཆན་མ་བཞེས་པར་ཕབ་ལེན་དང་བཟོ་བཅོས། བགོ་བཤའ། དགོས་མཁོ་གང་ལའང་བཀོལ་སྤྱོད་བྱས་ཆོག
བཟོ་མཁན་ལ་རྒྱབ་སྐྱོར་བྱེད་པའི་ཆེད་ཁོང་ཚོའི་བིལུ་པིརིན་ཊི་བརྒྱུད་ཐོན་སྐྱེད་ཉོ། བཟོ་མཁན་གྱིས བཟོ་མཁན་གྱི་ཁེ་ཕོགས ཚོང་པས་གཏན་འཁེལ་བྱས་པ། ཡང་ན་བིལུ་པིརིན་ཊི་འདིའི་པར་གསར་བཟོས་ཏེ་ཁྱེད་རང་གི་བིལུ་པིརིན་ཊི་ནང་མཐུད་སྦྲེལ་བྱས་ཏེ་ཡོང་སྒོ་བགོ་བཤའ་བྱེད།