艺术
美容与健康
工艺
文化与历史
娱乐
环境
食品与饮料
逆向工程
科学
体育
技术
可穿戴设备


Tides: Predicting Height and Stream
The tide does two quite separate things to a navigator, and confusing them is a common and expensive mistake. It changes the DEPTH of water, which decides whether you touch the bottom. And it produces a horizontal STREAM, which moves the boat sideways and decides where you arrive.
High water does not mean slack water, the strongest stream is usually near mid-tide, and a chart's depths are measured from a datum that is deliberately BELOW the lowest predicted tide — so charted depth is almost always less than what is actually there. Every one of those facts catches people out.
You will learn the twelfths rule for height, the rule of thirds for stream, and how to work out whether there will be enough water over a bar at the time you want to cross it. None of it needs more than arithmetic and a tide table.
中级
1 day
说明
1
1
Understand chart datum, and why depths are pessimistic
Understand chart datum, and why depths are pessimistic
Charted depths are given below CHART DATUM, which is set at or near the lowest astronomical tide — the lowest the tide is predicted ever to fall.
So the actual depth is the charted depth PLUS the height of tide at that moment, and it is almost always more than the chart says. Drying heights, printed underlined, are the opposite: they are heights ABOVE datum that uncover at low water. Reading one as the other is how a boat ends up aground on a bank the chart clearly showed.
2
2
Use the rule of twelfths for height between tides
Use the rule of twelfths for height between tides
Divide the range into twelfths and the interval into six hours: the tide moves 1, 2, 3, 3, 2, 1 twelfths in successive hours.
It is an approximation of a sine curve and it is good enough almost everywhere with a roughly semi-diurnal tide. It fails where the curve is distorted — the Solent's double high water, estuaries with a long stand, anywhere with a strong river flow — and in those places the tide table's own curve must be used instead.
3
3
Treat the stream separately, with the rule of thirds
Treat the stream separately, with the rule of thirds
The stream is weakest near the turn and strongest near mid-tide: roughly a third, two thirds, three thirds, three thirds, two thirds, a third of the maximum rate in successive hours.
Slack water is NOT at high water in most places — in a channel it usually comes an hour or more later, and off a headland it may not be slack at all. Use the tidal stream atlas or the diamonds on the chart, which are referenced to high water at a named standard port, and check which port.
4
4
Work out your own clearance, with a margin you decide first
Work out your own clearance, with a margin you decide first
Depth available equals charted depth plus height of tide. Subtract your draught and whatever safety margin you have chosen, and what remains is your clearance.
Decide the margin BEFORE you do the sum, or you will find yourself choosing a margin that makes the answer come out right. Allow for swell — in a metre of swell the trough is half a metre lower than the mean — and for the fact that a predicted height is a prediction, which a strong barometric high can lower by 0.3 metres.
5
5
Height, stream and the crossing window
Height, stream and the crossing window
正在加载 Jupyter 笔记本…
6
6
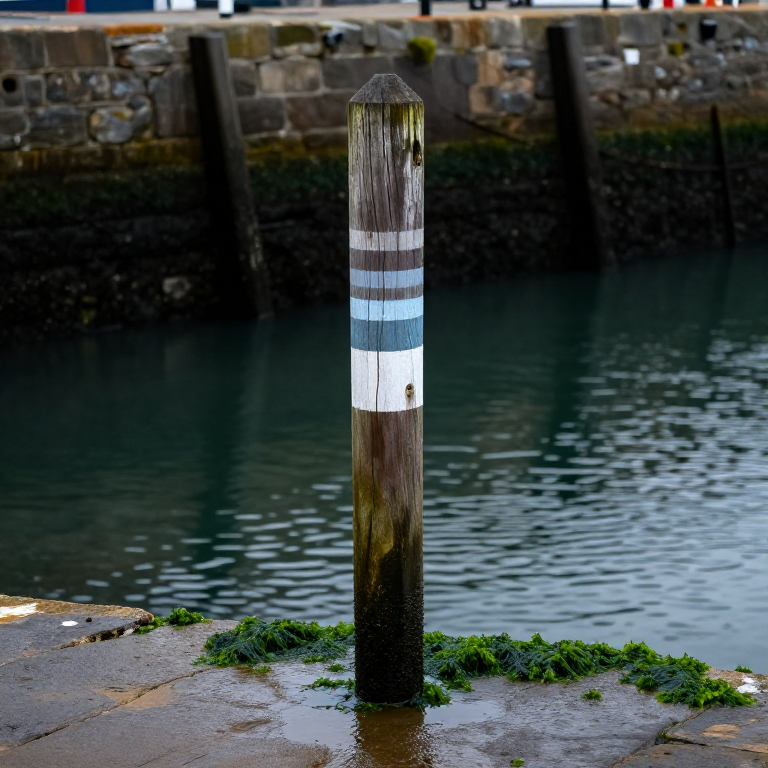
Check your prediction against a tide pole
Check your prediction against a tide pole
Mark a graduated pole at a known spot, read the actual water level against it hourly through a tide, and compare with the prediction.
You will usually find a consistent offset, and sometimes a time shift — both of which are local effects your tide table cannot know about. A day spent doing this at the place you use most is worth more than any amount of reading, and it turns a national prediction into a local one.
此步骤所需材料:
 木桩2 个
木桩2 个 油性记号笔1 个
所需工具:
 卷尺
卷尺 羊角锤
羊角锤相关蓝图
这些蓝图共享知识——技术、材料或原理




CC0 公共领域
此蓝图以 CC0 协议发布。你可以自由复制、修改、分发和使用此作品,无需征得许可。
通过购买蓝图中的产品支持创客,他们将获得 创客佣金 (由供应商设定),或创建此蓝图的新版本并将其作为连接包含在你自己的蓝图中以分享收入。