

Nomogram
Instruksi
Build the simplest one — addition
Build the simplest one — addition
Start where the geometry is obvious.
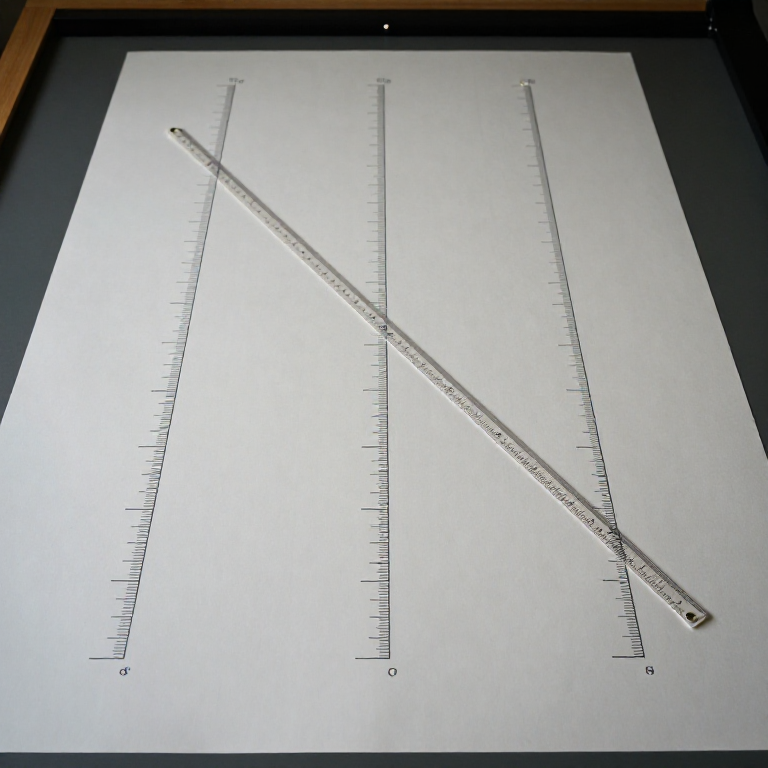
- Rule three parallel vertical lines, evenly spaced, on graph paper.
- Number the outer two identically, 0 to 10.
- Number the MIDDLE line 0 to 20, at half the spacing.
- Lay a straight edge from 3 on the left to 5 on the right and read the middle scale.
Material untuk langkah ini:
 Kertas Milimeter1 pad
 Penggaris1 buah
Turn it into multiplication
Turn it into multiplication
One substitution converts the whole chart.
- Rebuild the same three lines, but mark the outer scales logarithmically — position each number by its logarithm.
- Mark the middle scale logarithmically at half spacing.
- Lay the straight edge from 3 to 4 and read the middle.
Material untuk langkah ini:
 Set Pensil Grafit1 set
Build one for a formula you actually use
Build one for a formula you actually use
This is the real strength — a chart for a specific job.
- Pick a working formula with three quantities, such as flow rate from pipe area and velocity.
- Work out the scale spacing so that the relationship holds along a straight line.
- Draw it, label the scales with real units, and check three known cases by hand.
Material untuk langkah ini:
 Kertas Karton1 bungkus
Hand it to someone untrained
Hand it to someone untrained
The decisive comparison is not speed. It is who can use it.
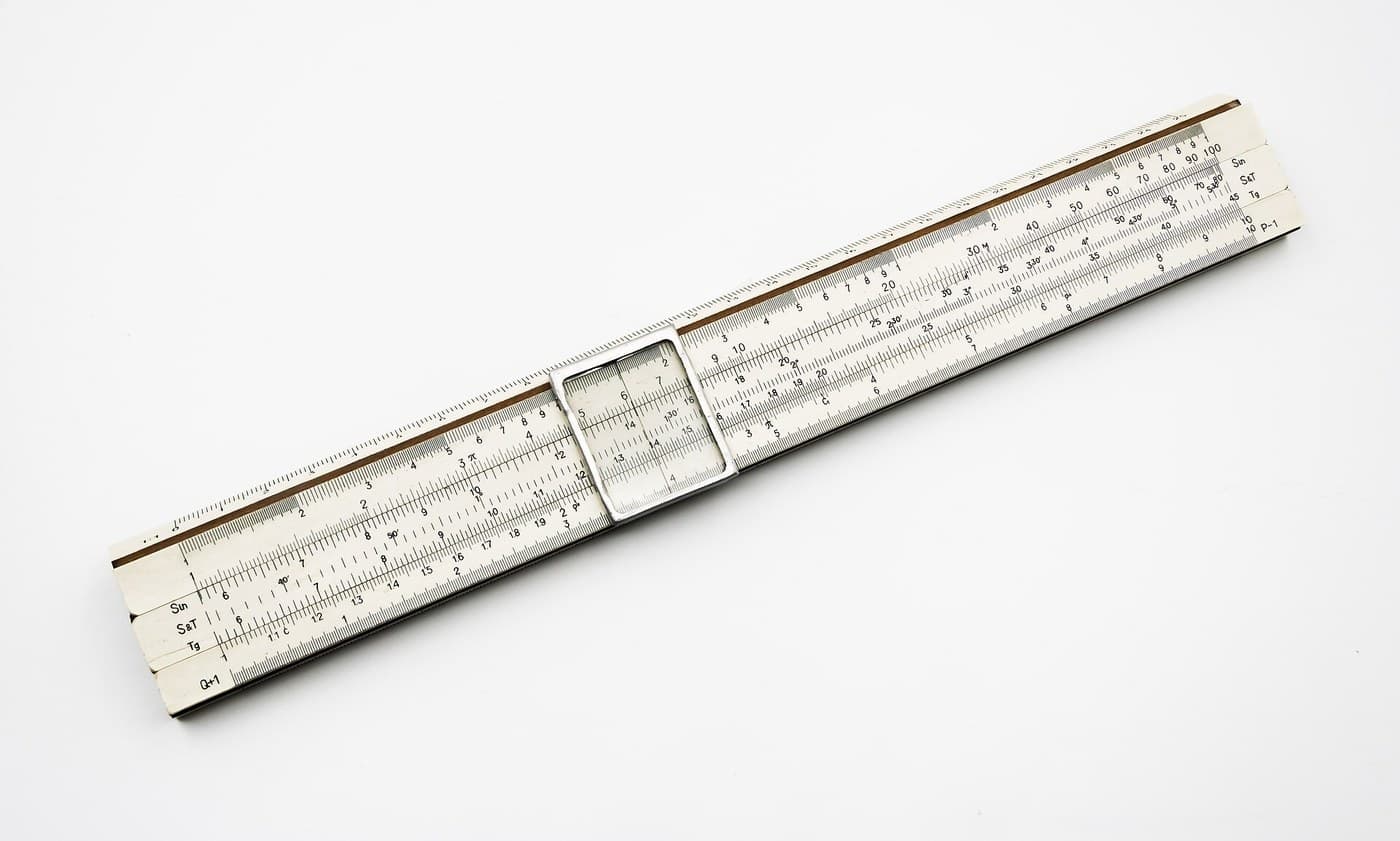
- Give a slide rule to someone who has never used one and ask for a specific calculation. Time it.
- Give them your nomogram and ask the same question. Time it.
- Count errors in both.
Material untuk langkah ini:
 Stopwatch1 buah
History and context
History and context
Philbert Maurice d'Ocagne, a French engineer, systematised the field and gave it the name nomographie in the 1880s and 1890s, showing how to construct an alignment chart for a wide class of relationships. Earlier charts of the same spirit existed — Léon Lalanne's work in the 1840s among them — but d'Ocagne turned the practice into a method that could be taught.
They were everywhere for most of a century. Artillery range tables, aircraft weight and balance, chemical engineering, medicine, ballistics, photographic exposure — anywhere a formula was applied over and over by people who had no reason to learn the mathematics behind it. That is the design case: encode the expertise once, in the chart, so the user needs none.
They did not disappear because they were wrong. Calculators and then computers made the general instrument cheap enough that purpose-built charts stopped being worth printing. But nomograms survive exactly where their properties still win — no power, no failure mode, readable in poor light with wet hands, and impossible to mis-key. Medical dosing charts and dive tables are nomograms, and a dive table works at depth in a way no calculator can be relied upon to.
Where it sits among its neighbours: Napier's logarithms convert multiplication to addition on paper; the slide rule embodies that conversion in a movable instrument; the nomogram embodies a SPECIFIC formula in a fixed chart; Genaille-Lucas rulers precompute every carry into printed arrows. All four move effort from the user into the artefact, each stopping at a different point along that line — which is precisely the comparison worth having.
Bahan
5- 1 padPlaceholder
- 1 buahPlaceholder
- 1 setPlaceholder
- 1 bungkusPlaceholder
- 1 buahPlaceholder
Blueprint terkait
Blueprint ini berbagi pengetahuan — teknik, bahan, atau prinsip

CC0 Domain Publik
Cetak biru ini dirilis di bawah CC0. Anda bebas untuk menyalin, memodifikasi, mendistribusikan, dan menggunakan karya ini untuk tujuan apa pun, termasuk komersial, tanpa meminta izin.
Dukung Maker dengan membeli produk melalui Cetak Biru mereka di mana mereka mendapatkan Komisi Pembuat yang ditetapkan oleh Penjual, atau buat iterasi baru dari Cetak Biru ini dan masukkan sebagai koneksi di milik Anda sendiri.