فن
خوبصورتی اور تندرستی
دستکاری
ثقافت اور تاریخ
تفریح
ماحول
خوراک اور مشروبات
ریورس انجینئرنگ
سائنسز
کھیل
ٹیکنالوجی
پہننے والے آلات

The Erbium-Doped Fibre Amplifier
By the mid-1980s fibre had won on land. Under an ocean it had not, because every 40 or 50 kilometres the signal had to be turned back into electricity, decided bit by bit, and used to drive a fresh laser. Each of those regenerators was a rack of electronics in a pressure housing on the sea floor, built for one bit rate and one wavelength, and expected to work untouched for twenty-five years.
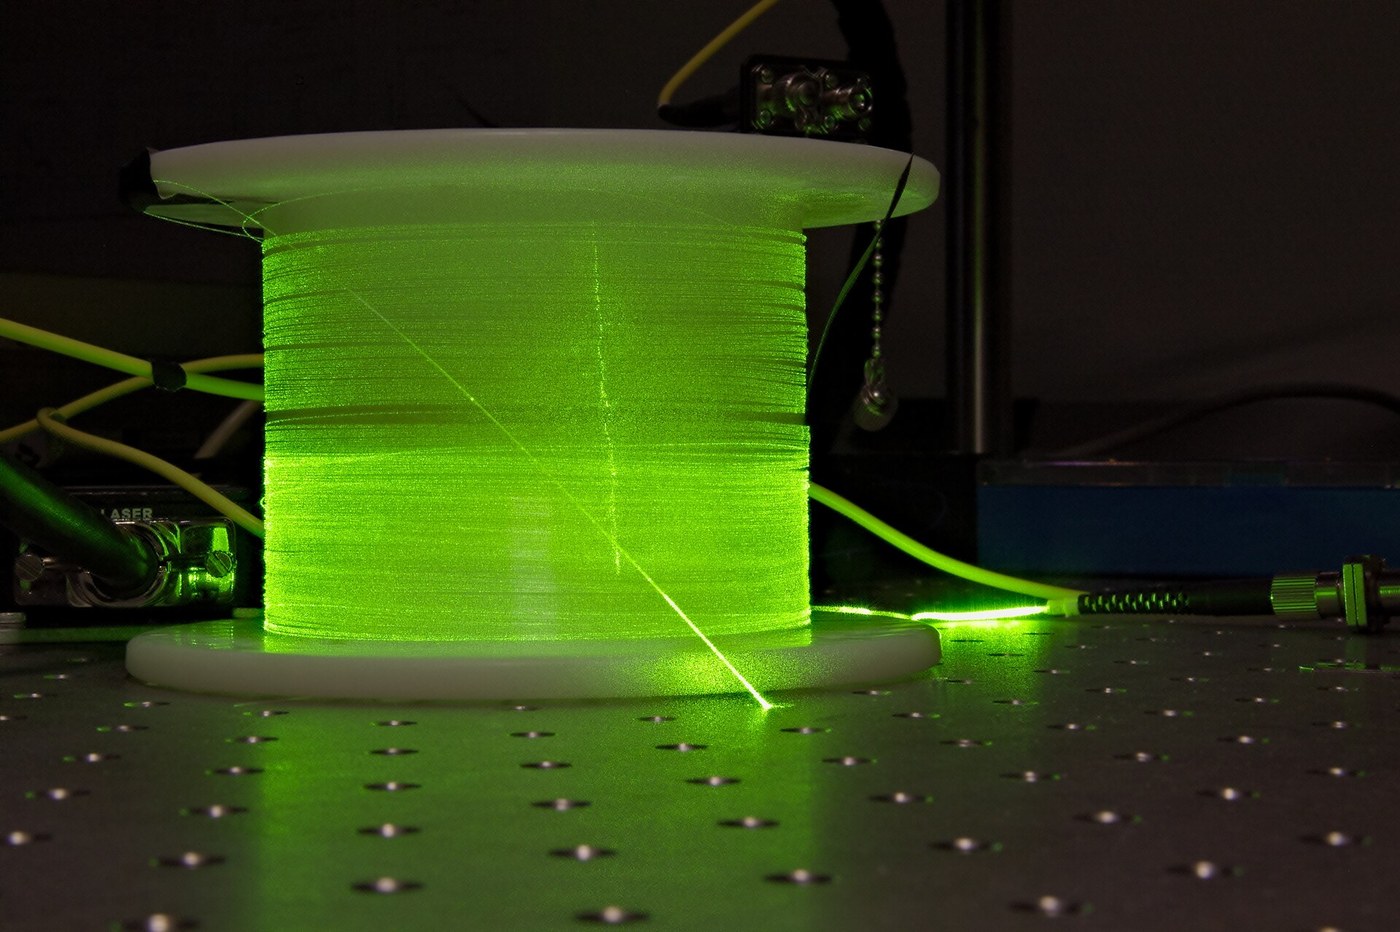
In 1987 David Payne's group at the University of Southampton — Mears, Reekie, Jauncey and Payne — published a short paper in Electronics Letters describing a fibre amplifier that needed no electronics at all. Dope a couple of metres of the fibre core with erbium ions, shine a pump laser down it, and the erbium's excited ions are stimulated by the passing signal to emit into exactly the same mode, at exactly the same wavelength, with exactly the same phase. The signal comes out twenty or thirty decibels stronger and it never stopped being light. Desurvire, Simpson and Becker at Bell Labs reached the same result independently the same year.
The luck in it is worth naming. The transition between erbium's two lowest levels happens to emit between 1530 and 1565 nm, and silica's loss minimum happens to sit at 1550 nm. Nobody arranged that. Had the erbium band landed a hundred nanometres either side, the story of long-haul optics would be a different one.
The consequence was larger than the invention. Because a lump of doped glass has no idea what the light is carrying, one amplifier serves every wavelength in the band at once, at any bit rate, in any format. Wavelength-division multiplexing became economic overnight, and the transatlantic cables of 1996 were built on it.
MEASURED AND MODELLED. You will not build an amplifier — the pump diode, the wavelength coupler and the isolators are laboratory parts. What you will do is measure a real link budget on the bench until the receiver fails, then compute exactly what an amplifier every 80 km buys and what it costs in accumulated noise.
اعلیٰ
4 hours
ہدایات
1
1
Find where your own link dies
Find where your own link dies
Set up the plastic-fibre link from the low-loss fibre blueprint: laser module in, transimpedance receiver out, 10 m of fibre between. Drive the source with a 10 kHz square wave from the function generator and watch the received waveform on the scope.
Now attenuate it deliberately and repeatably. Wrap the fibre around cylinders of decreasing diameter — a 30 mm bottle, a 20 mm marker, a 12 mm dowel, a 6 mm drill shank — adding one turn at a time. Each turn costs a measurable, repeatable number of decibels, and bend loss rises steeply as the radius falls.
At each step record the received optical level on the meter AND the peak-to-peak amplitude on the scope, and note when you can no longer distinguish the square wave from the noise. That point is your receiver sensitivity, measured rather than quoted.
The whole of the rest of this blueprint is the same measurement scaled up by a factor of a hundred thousand.
اس مرحلے کے لیے مواد:
 Optical Fibre Bundle (2mm)10 میٹر
درکار اوزار:
 Laser Diode Module Set
 Photodiode (BPW34)
 Digital Oscilloscope
 Function Generator (10MHz)
 Fibre Optic Power Meter
 Laser Safety Glasses
2
2
Span budget, accumulated noise, and why erbium
Span budget, accumulated noise, and why erbium
Jupyter نوٹ بک لوڈ ہو رہی ہے…
درکار اوزار:
 Desktop Computer
3
3
Find the fault in an amplified span
Find the fault in an amplified span
The diagnostic tree a field engineer actually works down. Note the branch most people miss: full optical power at the receiver and errors anyway. An amplifier chain will cheerfully deliver its rated power made largely of its own spontaneous emission, so a power meter reads perfect while the link is dead.
That failure mode does not exist on a regenerated link, and it is the hidden cost of amplifying instead of regenerating. It is also why OSNR, not power, is the number that gets monitored on a modern optical network.
Flow
FINDING A FAULT IN AN AMPLIFIED FIBRE SPAN
Work top down. Each branch ends in a measurement, not a guess.

START: the link is down or degraded.

1. IS THERE ANY LIGHT AT THE RECEIVER? (optical power meter at the receive port)
   NO LIGHT AT ALL -> go to 2.
   LIGHT, BUT LOW  -> go to 3.
   LIGHT AT NORMAL LEVEL, STILL ERRORS -> go to 4.

2. NO LIGHT. The path is broken.
   - Shoot an OTDR from the receive end. The trace ends where the fibre ends.
     A near-vertical drop to the noise floor with a reflective spike = a clean BREAK
     or an unmated connector. Without a spike = a crushed or bent fibre.
   - Distance on the OTDR is optical, so divide by the group index (about 1.468)
     to get metres of cable, then apply the cable's own slack factor to get metres
     of duct. Skipping that step is how digging teams end up in the wrong field.
   - No break on the trace? Check the transmitter: laser bias current, and whether
     an amplifier upstream has shut down on its own loss-of-signal interlock.

3. LOW LIGHT. Something is eating the budget.
   - Compare against the commissioning record. You are looking for a CHANGE.
   - A step in the OTDR trace with no reflection = a splice or a bend that has
     degraded. A step WITH a reflection = a connector.
   - Loss that is much worse at 1550 nm than at 1310 nm = macrobending. Loss that
     is similar at both = a splice, a connector, or a break in the coating.
   - Dirty connectors are the single commonest cause. Inspect with a fibre scope
     BEFORE cleaning, so you learn whether it was dirty; then clean and re-measure.
   - Amplifier output down? Check pump laser current and case temperature first.

4. NORMAL POWER, STILL ERRORS. The power is fine; the SIGNAL is not.
   - Measure OSNR on a spectrum analyser, not power on a meter. An amplifier chain
     happily delivers full power made largely of its own spontaneous emission.
   - OSNR low -> an amplifier in the chain has lost pump power and the ones after
     it are amplifying noise to make up the level. Find the first one whose output
     spectrum has a raised noise floor; the fault is AT it, not after it.
   - OSNR fine -> suspect dispersion or nonlinearity. Has anyone changed the launch
     power? Too MUCH power is a real fault: above roughly +3 dBm per channel,
     four-wave mixing and self-phase modulation start corrupting the signal, and
     turning the amplifier DOWN fixes it.
   - Errors that come and go with the weather = a duct or a joint closure moving.

RULE THAT SAVES THE MOST TIME: always compare against the commissioning trace.
An absolute number tells you little; a CHANGE from the day it was installed tells
you where to dig.
درکار اوزار:
Fibre Optic Power Meter4
4
Compendium: what is inside one, and what it cost
Compendium: what is inside one, and what it cost
WHAT IS IN THE BOX. A few metres of silica fibre whose core carries a few hundred parts per million of erbium, put there during the MCVD deposition of the previous blueprint. A pump diode at 980 or 1480 nm. A wavelength coupler to put pump and signal into one core. And an optical isolator at each end — without them the 0.1 % reflection off a connector face turns a 30 dB amplifier into a laser, assembling this batch's first blueprint by accident.
WHY IT IS QUIET, AND WHY IT CANNOT BE SILENT. Stimulated emission copies the triggering photon into the same mode, wavelength, direction and phase. But some excited ions decay spontaneously anyway, and the rest of the fibre amplifies that too. Amplified spontaneous emission sets a floor: a perfectly inverted amplifier still has a 3 dB noise figure, and real ones reach 4 to 5 dB. The 3 dB is a quantum-mechanical requirement on any phase-insensitive amplifier, not an engineering shortcoming.
980 OR 1480 NM. 980 nm lifts ions into a level that empties downward almost instantly, so the inversion is near complete and the noise figure approaches the limit. 1480 nm pumps straight into the top of the laser level: less energy wasted as heat, so more signal power per watt, but a less complete inversion and a worse noise figure. Long cables use 980 nm at the front where noise matters and 1480 nm further along where power does.
THE SIBLING, MEASURED. Electronic regenerator: detects, re-times, re-shapes, retransmits. Noise does NOT accumulate, so reach is unlimited — but it is one unit per wavelength, three pieces of electronics each, locked to one bit rate and format. EDFA: one unit for the whole band whatever the channel count, transparent to bit rate and format, no electronics in the signal path — but noise accumulates and every doubling of span count costs 3 dB. At one wavelength the regenerator wins on signal quality. At eighty it needs 240 pieces of undersea electronics per site and the amplifier still needs one. That is why WDM and the EDFA arrived as a pair.
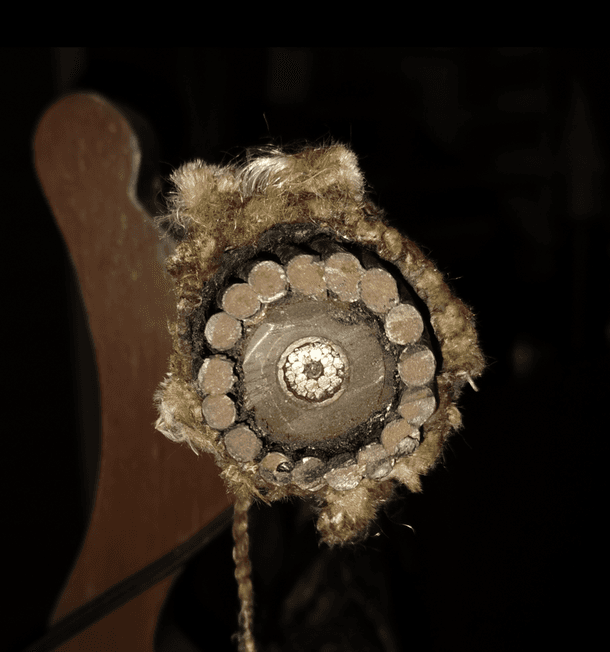
WHERE THIS BATCH ENDS. The 1858 submarine telegraph cable moved about eight words a minute and destroyed itself within weeks. TAT-12 and TAT-13, laid in 1996, were the first transatlantic systems built on erbium amplifiers instead of regenerators. Same ocean, same problem: what five thousand kilometres of a medium does to a signal. Copper's answer was to send slower. Glass's answer was to make the medium amplify.
مواد
1- 10 میٹرپلیس ہولڈر
درکار اوزار
7- پلیس ہولڈر
- پلیس ہولڈر
- Digital Oscilloscope10% کمیشنMagento Legacy Storeships internationallyپلیس ہولڈر
- پلیس ہولڈر
- پلیس ہولڈر
- پلیس ہولڈر
- پلیس ہولڈر
متعلقہ بلیو پرنٹ
یہ بلیو پرنٹ علم بانٹتے ہیں — تکنیک، مواد یا اصول
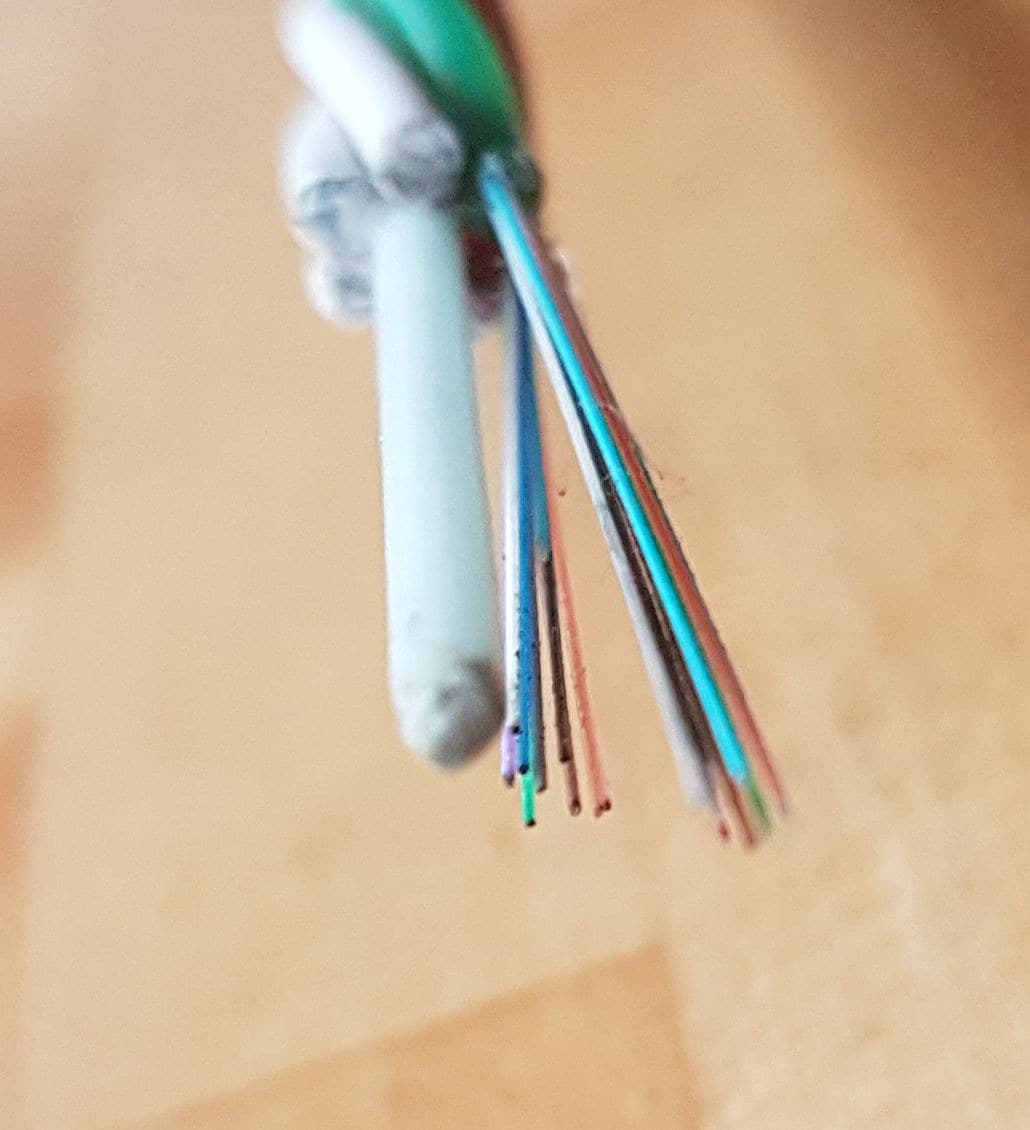
Low-Loss Optical Fibre
Mary کی طرف سے
کیمیا
38
0
0
0
0
0
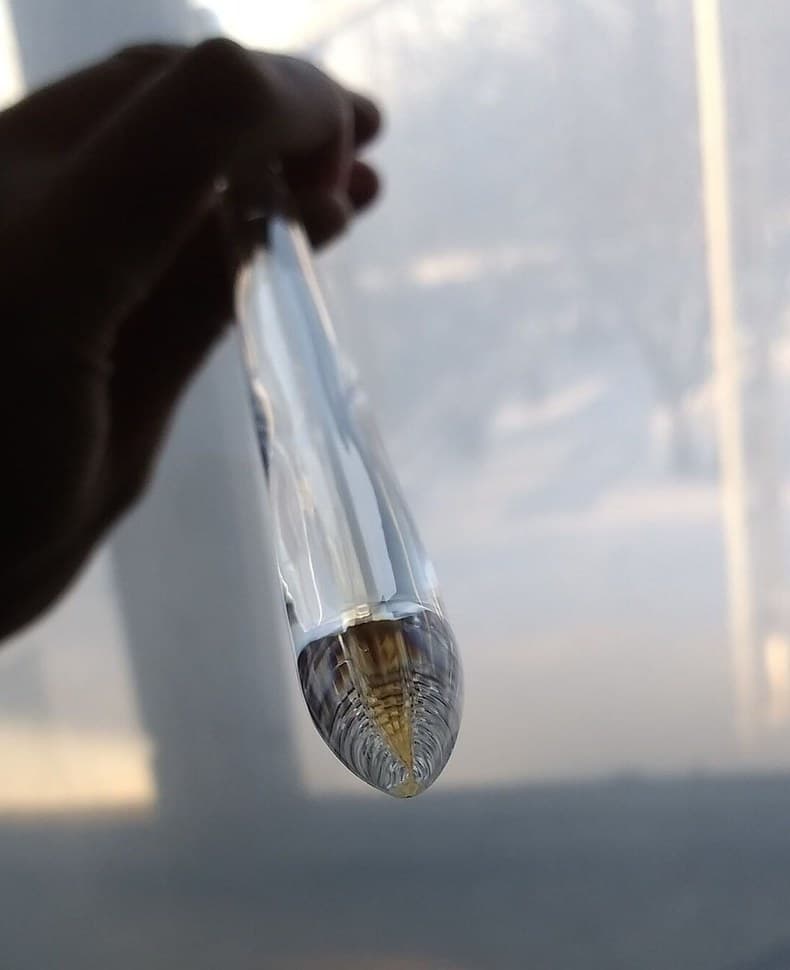
The MCVD Preform and the Draw Tower
Mary کی طرف سے
کیمیا
38
0
0
0
0
0
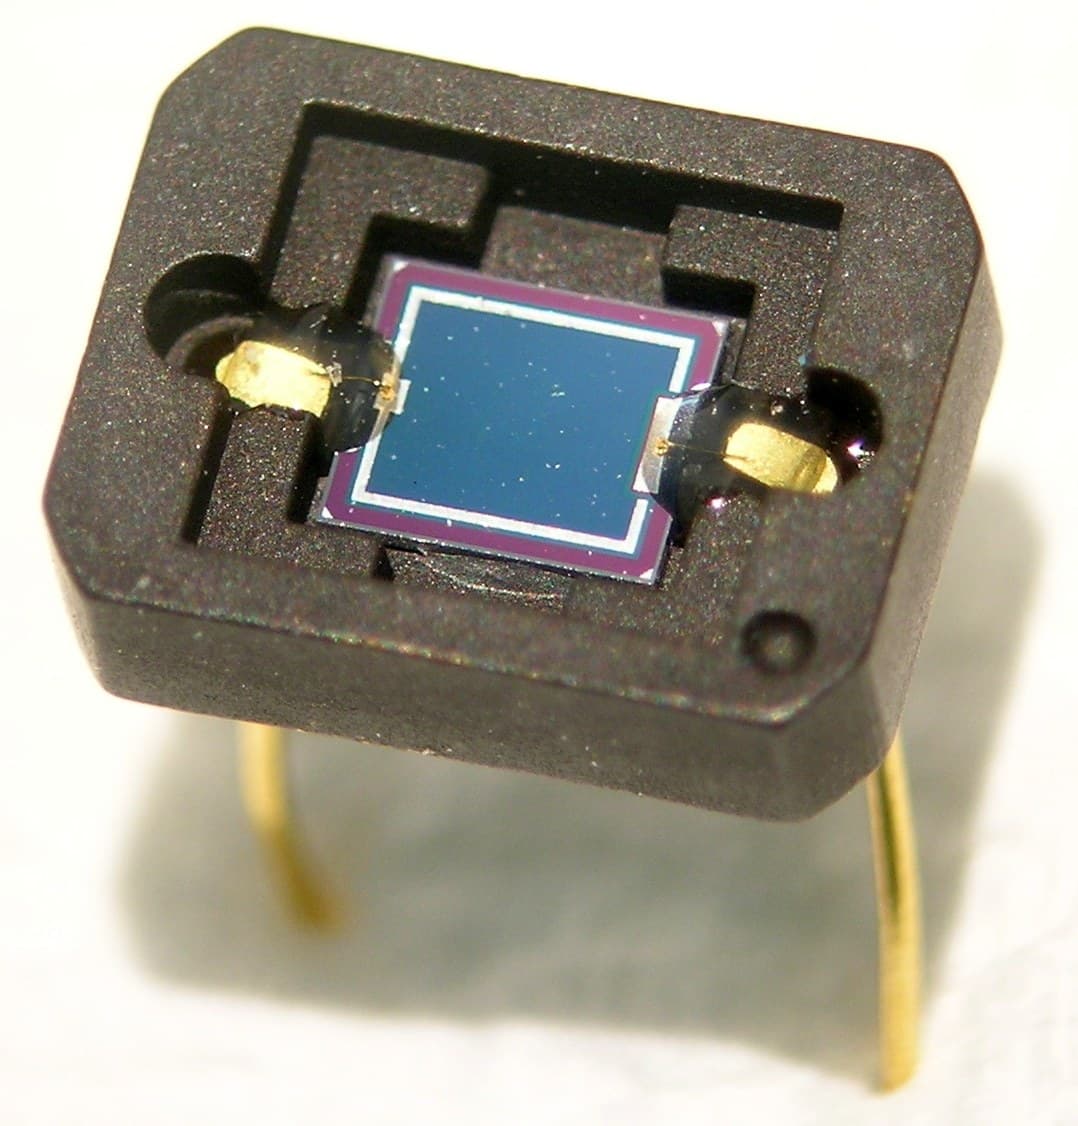
The Avalanche Photodiode Receiver
Ed کی طرف سے
الیکٹرانکس
31
0
0
0
0
0
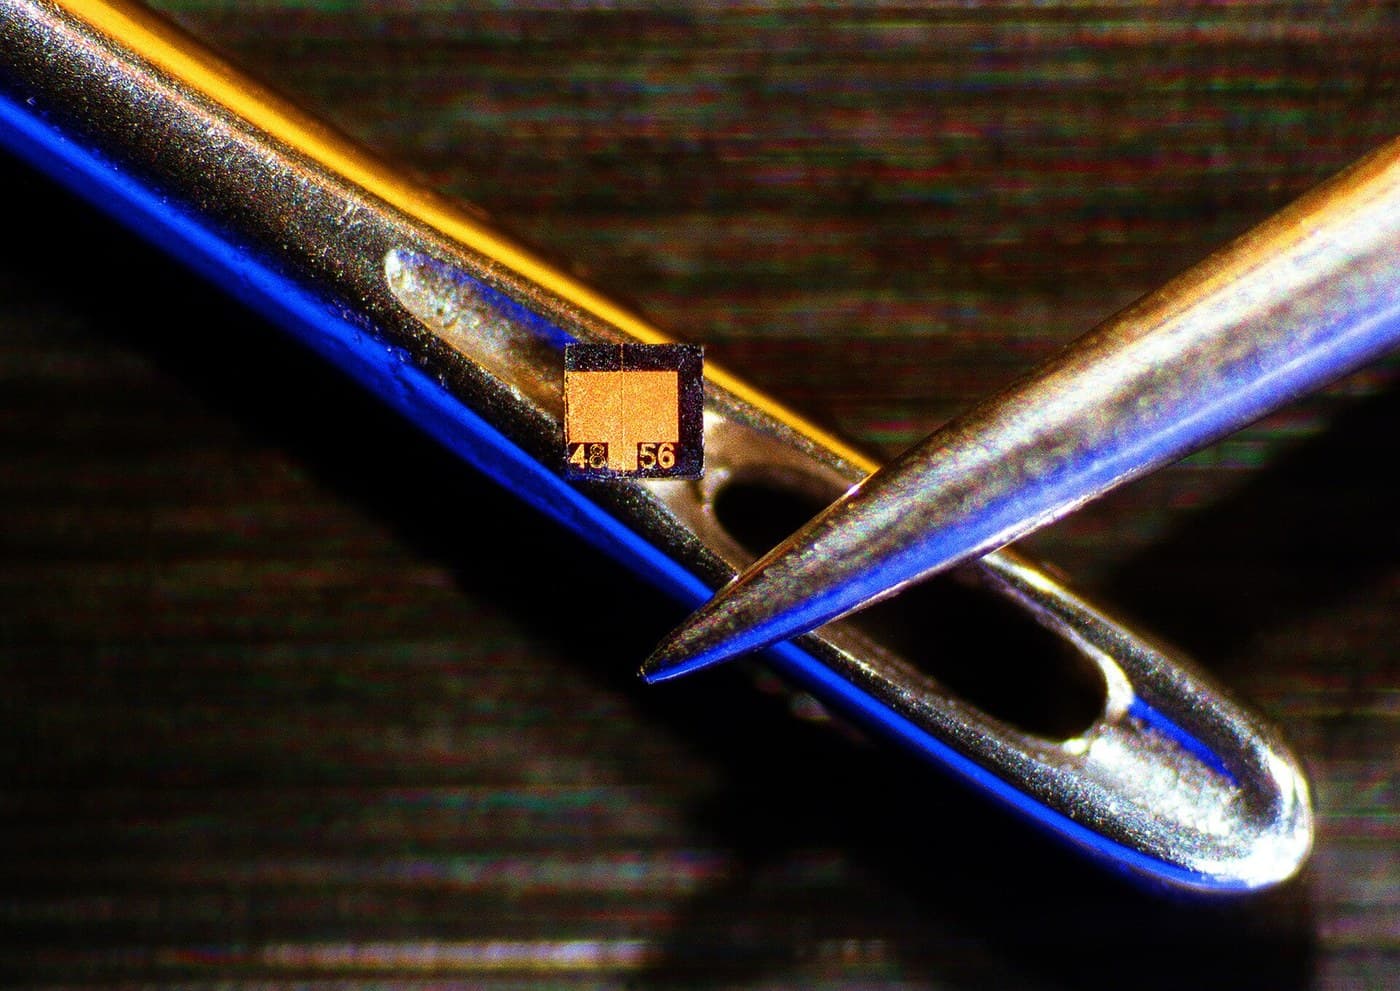
The Semiconductor Laser Diode
Ed کی طرف سے
الیکٹرانکس
31
0
0
0
0
0
The Submarine Telegraph Cable
Mary کی طرف سے
وائرلیس
24
0
0
0
1
0
The Helium-Neon Laser
Penny کی طرف سے
الیکٹرانکس
27
0
0
0
0
0
CC0 پبلک ڈومین
یہ بلیو پرنٹ CC0 کے تحت جاری کیا گیا ہے۔ آپ اجازت لیے بغیر اس کام کو نقل، ترمیم، تقسیم اور کسی بھی مقصد کے لیے استعمال کرنے کے لیے آزاد ہیں۔
میکر کی حمایت کریں ان کے بلیو پرنٹ کے ذریعے پروڈکٹس خرید کر جہاں وہ میکر کمیشن وینڈرز کی طرف سے مقرر، کماتے ہیں، یا اس بلیو پرنٹ کی نئی تکرار بنائیں اور آمدنی شیئر کرنے کے لیے اسے اپنے بلیو پرنٹ میں کنکشن کے طور پر شامل کریں۔