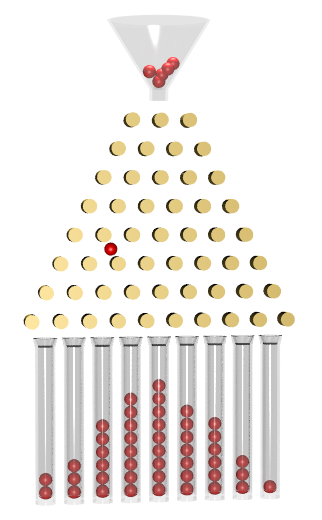


Galton Board
Amabwiriza
Build the peg array
Build the peg array
Staggered rows, even spacing, and a single entry point.
- Mark a triangular grid on a backing board — each row offset by half a spacing from the one above.
- Fix pegs at the marks, spaced a little over one ball diameter apart.
- Add a funnel at the apex so every ball enters at the same point.
Ibikoresho by'iyi ntambwe:
 Urupapuro rw'ibiti byometse1 agapaki
 Inkoni z'Ibiti1 igice
Add bins and run a few hundred balls
Add bins and run a few hundred balls
Collect the outcomes and let the shape appear.
- Fit vertical dividers below the last row to make bins.
- Drop balls one at a time — several hundred.
- Do not smooth or shake the board.
Ibikoresho by'iyi ntambwe:
 Amabuye y'ibirahure300 ibice
Predict the bins before you look
Predict the bins before you look
The distribution is calculable, and it is Pascal's triangle.
- For a board of n rows, write out row n of Pascal's triangle.
- Divide each entry by 2ⁿ to get the expected proportion per bin.
- Multiply by your number of balls and compare with the actual heights.
Ibikoresho by'iyi ntambwe:
 Urupapuro rw'Imirongo1 pad
Vary the sample size and the fairness
Vary the sample size and the fairness
Two experiments that show what the result does and does not depend on.
- Run 20 balls, then 100, then 500, recording the shape each time.
- Now tilt the whole board slightly to one side and run 300 more.
Ibikoresho bikenewe:
 Iminzani ya Digitale yo mu Gikoni
History and context
History and context
Francis Galton described the device — he called it a quincunx — in the 1870s, to demonstrate visibly that binomial trials converge on the normal distribution. It is a physical demonstration of the central limit theorem: sums of many independent random variables tend toward a normal distribution more or less whatever the individual variables look like, which is why the bell curve turns up in measurement error, in heights, and in noise.
Galton's other work needs stating plainly. He coined the word eugenics and founded it as a programme, arguing that human breeding should be directed on the basis of inherited ability. Those ideas were used to justify sterilisation laws and worse across the twentieth century. He also made genuine and lasting contributions — regression to the mean, correlation, the use of fingerprints for identification — and the statistical tools and the eugenic programme came from the same conviction that human variation could be measured and ranked. Both belong in an honest account of him.
Regression to the mean has its own quincunx demonstration, and it is Galton's most under-appreciated idea: extreme results tend to be followed by less extreme ones for purely statistical reasons. Missing that is why people credit interventions that did nothing — the patient who was worst was always likely to improve, and the school that scored lowest was always likely to rise.
Modern versions sit in science museums everywhere, and the board is also a working analogue computer for the binomial distribution: it computes Pascal's triangle by letting gravity and geometry do the arithmetic.
Ibikoresho
4- 1 agapakiUmwanya
- 1 igiceUmwanya
- 300 ibiceUmwanya
- Umwanya
Ibikoresho bikenewe
1Blueprint zijyanye
Izi blueprint zisangira ubumenyi — uburyo, ibikoresho cyangwa amahame

CC0 Umurenge rusange
Iyi blueprint yasohowe munsi ya CC0. Ushobora gukoporora, guhindura, gukwirakwiza no gukoresha nta kwemererwa.
Shyigikira Umuremyi ugura ibicuruzwa binyuze muri Blueprint ye Komisiyo y'Umuremyi byashyizweho n'Abacuruzi, cyangwa kora verisiyo nshya y'iyi Blueprint ukayinjiza nk'isano muri Blueprint yawe kugira ngo musangire inyungu.