
Logging Temperature with Python
A data logger is the smallest complete instrument there is: something that senses, something that records, and a clock. Once you have built one, an enormous number of questions that were previously arguments become measurements — how cold the north bedroom really gets at 4 a.m., how long the oven actually takes to recover after the door opens, whether the compost heap is heating.
The point of doing it in code rather than buying a logger is that you control the sampling, and sampling is where measurement is won or lost. Sample too slowly and you miss the event entirely; sample too fast and you fill a card with data nobody will ever read. The interval is a decision about what you are trying to see.
The sensor here is a DS18B20, which is a small digital thermometer that reports a number over a one-wire bus. It is worth understanding why that matters: an analogue sensor gives a voltage that your wiring, your supply and your converter all corrupt, and every one of those errors is invisible. A digital sensor does the conversion inside the package and hands you a value that cannot be degraded by the cable.
This is not a computer exercise. You will calibrate against a real thermometer, put the probe in real places, and find that the interesting part is the physical world, not the script.
Amabwiriza
Wire the sensor and confirm it answers
Wire the sensor and confirm it answers
Connect the DS18B20 to power, ground and the data line, with the required pull-up resistor between data and power.
Read it once and print the value.
Get one good reading before writing anything else. Almost every failure in this build is wiring — a missing pull-up resistor gives no device, and reversed power destroys the sensor immediately and silently.
Ibikoresho by'iyi ntambwe:
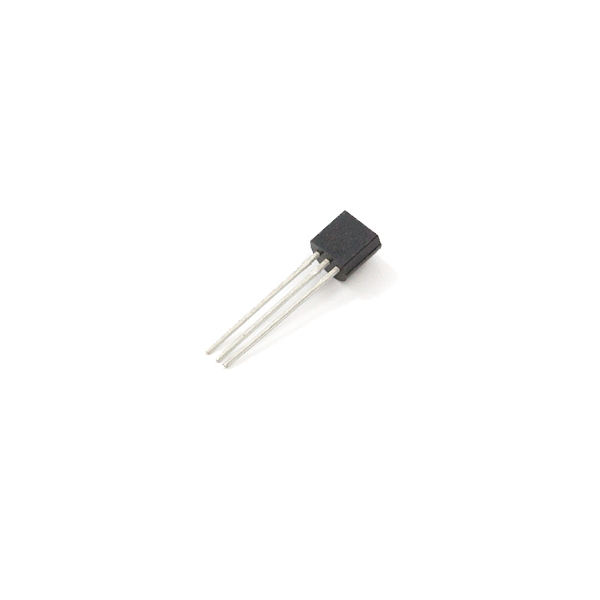 One Wire Digital Temperature Sensor - DS18B201 igice
 Ikusanyirizo ry'Ibirwanya Amashanyarazi bya 1/4 W1 ibikoresho
 Ikibaho cy'Ibizamini1 igice
Ibikoresho bikenewe:
 Raspberry Pi 4 Modeli B (RAM ya 4 GB)
 Umutwe w'insinga za Dupont (igabo-igore)
Calibrate against something physical
Calibrate against something physical
Put the sensor and a reference thermometer together in stirred iced water, then in warm water, and record both readings at each.
Compute the offset.
Expect a small but real difference.
An uncalibrated logger produces confident wrong numbers, and the whole value of the exercise is that you can state the uncertainty of your data rather than trusting a datasheet.
Ibikoresho bikenewe:
 Igipima Ubushyuhe
Write the logger, and timestamp everything
Write the logger, and timestamp everything
Write a short Python loop that reads the sensor, writes an ISO-8601 timestamp and the value as one line of CSV, flushes the file, and sleeps for the interval.
Flush every write.
Data buffered in memory is data you lose when the power goes. Append-and-flush costs nothing and turns a fragile script into one you can unplug.
Ibikoresho by'iyi ntambwe:
 Ikarita ya microSD (GB 32, icyiciro 10)1 igice
Choose the interval by experiment
Choose the interval by experiment
Log the same event — a door opening, an oven recovering, a kettle cooling — at 1 s, 10 s and 60 s intervals.
Plot all three.
Expect the 60 s trace to miss the event's shape entirely and possibly to miss it altogether.
Sampling slower than the thing you are measuring does not give you a rougher answer, it gives you a wrong one — which is aliasing, and it is why the interval is a design decision.
Ibikoresho bikenewe:
 Urupapuro rw'Imirongo
Deploy it somewhere that will surprise you
Deploy it somewhere that will surprise you
Run it for at least 48 hours in a real location — a fridge, a greenhouse, a bedroom, outdoors in a shaded shelter.
Plot the whole run.
Expect structure you did not expect: fridge compressor cycles, the heating schedule, the daily solar curve, and the lag between outdoor and indoor peaks.
The value of a logger is that it watches while you are not.
Make it survive reality
Make it survive reality
Add the three things that separate a script from an instrument: catch and log read errors rather than crashing, start automatically on boot, and write to a new file each day.
Then pull the power mid-run and restart it.
Expect it to resume with a gap in the data and no corruption.
A logger that stops silently at 2 a.m. and is discovered a week later has cost you the week.
Compendium — sampling, drift and honest data
Compendium — sampling, drift and honest data
Why a digital sensor changes the engineering. The DS18B20 measures temperature and converts it to a number inside the chip, then sends that number over a single data line with a checksum. Nothing downstream can corrupt it — a long cable, a noisy supply or a poor connection either delivers the value intact or fails the checksum outright. An analogue thermistor, by contrast, hands you a voltage that every metre of cable and every millivolt of supply variation quietly biases. Digitising at the sensor is one of the central ideas of modern instrumentation, and this is the cheapest place to see why.
Sampling theory, in the one form that matters here. To reconstruct a signal you must sample faster than twice its highest frequency of interest; below that, fast variation does not simply disappear — it folds back and appears as slow variation that was never there. That is aliasing, and step 4 demonstrates it. In slow thermal work the practical rule is to sample several times faster than the fastest change you care about, and to know that the sensor's own thermal mass sets a floor: a probe in a metal sheath cannot report a change faster than it can physically warm up.
What separates a logger from a measurement. Timestamps in a defined format, ideally UTC, so the record survives daylight-saving changes. A recorded calibration offset. A note of where the sensor physically was, because "in the greenhouse" and "in direct sun on the greenhouse floor" are different experiments. And the raw data kept unmodified, with corrections applied in analysis rather than at write time. Every one of these is cheap at the time and impossible to reconstruct afterwards — the same lesson as the collection data on a spore print or a herbarium sheet.
Where this sits in the corpus. A logger is the direct descendant of the recording barometer and thermograph, which scratched a trace onto a rotating drum — the same three components, with a clockwork clock and an ink pen instead of a timestamp and a file. It is also the smallest honest example of what Industry 4.0 actually means: an instrument that produces machine-readable data as its primary output, from which the entire apparatus of dashboards, alerting and model-fitting follows. The interesting engineering is at the sensor and in the sampling, and it always was.
Practical and safe notes. Check the pinout against the datasheet every time — a reversed DS18B20 gets hot and dies in seconds. Use a waterproof-sheathed version for anything damp and do not submerge a bare sensor. Keep mains away from the project entirely: for fridge, freezer or outdoor work, run from a battery or a low-voltage supply and route the cable through an existing seal rather than making a hole. And do not log anything about people without their knowledge — a logger in a shared room is a measurement of the people in it.
Ibikoresho
4- One Wire Digital Temperature Sensor - DS18B2010% komisiyo1 igice$4.45
- Umwanya
- Umwanya
- Umwanya
Ibikoresho bikenewe
4- Umwanya
- Umwanya
Ibikoresho by'Ibishushanyo Bifitanye Isano

Blueprint zijyanye
Izi blueprint zisangira ubumenyi — uburyo, ibikoresho cyangwa amahame
CC0 Umurenge rusange
Iyi blueprint yasohowe munsi ya CC0. Ushobora gukoporora, guhindura, gukwirakwiza no gukoresha nta kwemererwa.
Shyigikira Umuremyi ugura ibicuruzwa binyuze muri Blueprint ye Komisiyo y'Umuremyi byashyizweho n'Abacuruzi, cyangwa kora verisiyo nshya y'iyi Blueprint ukayinjiza nk'isano muri Blueprint yawe kugira ngo musangire inyungu.