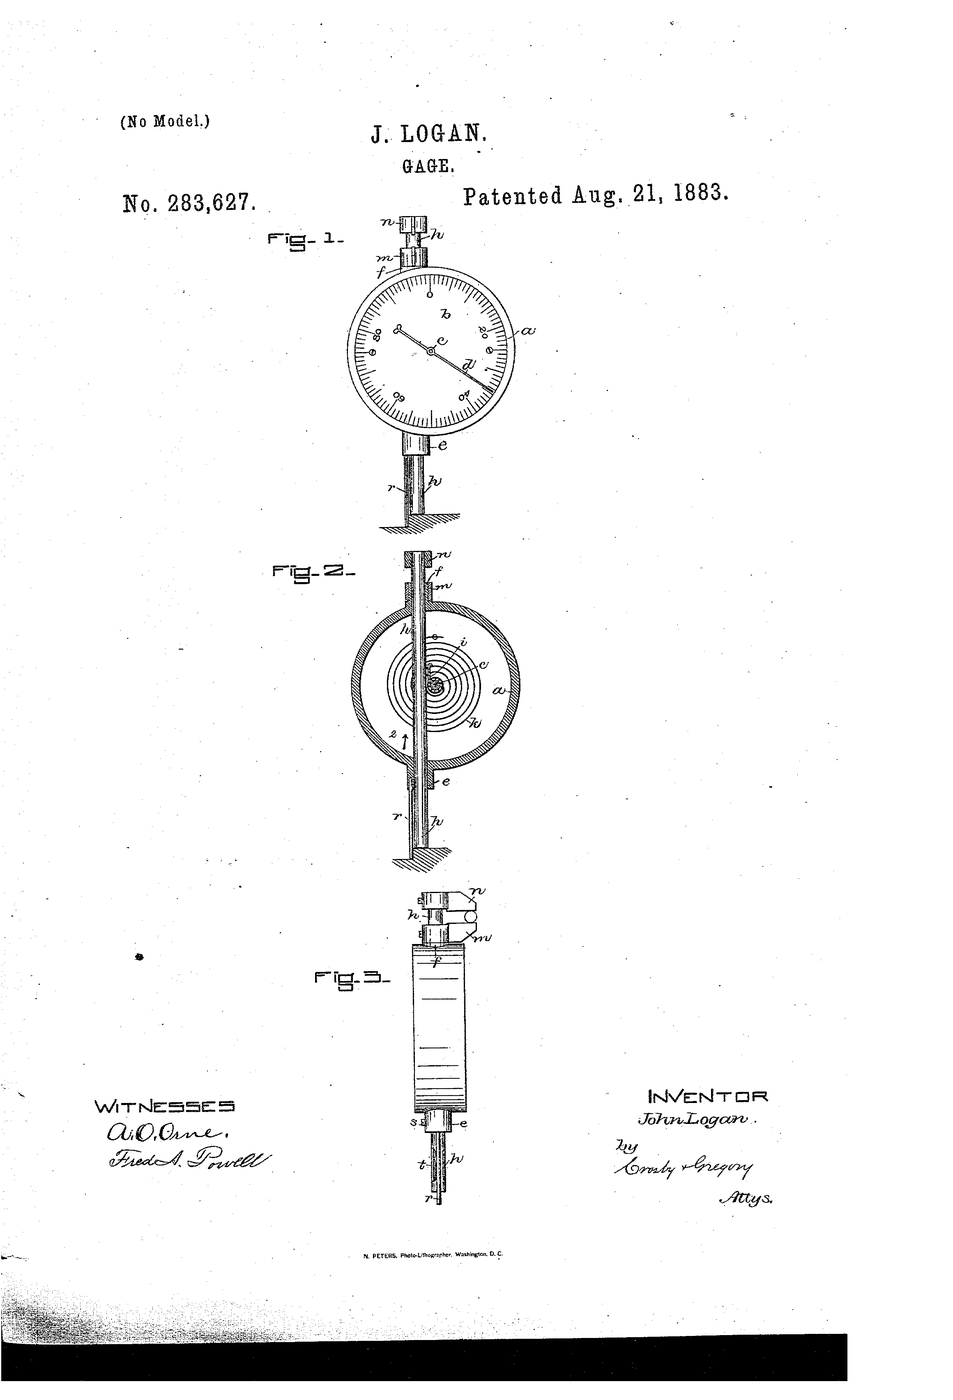


Dial Indicator
A micrometer answers “how big is this?”. A dial indicator answers a different and often more useful question: “how much has this moved?” It does not measure size at all. It measures deviation.
US 283,627, “Improvement in Gages”, John Logan of Waltham, Massachusetts, filed 15 May 1883 and granted 21 August 1883. The claim is mechanical amplification: a tiny movement of a plunger is geared up into a large sweep of a pointer, so the eye reads a distance it could never see directly.
Waltham is not a coincidence. This is watchmaking country, and a watch is a machine for turning small regular motions into readable ones. Logan applied the movement-maker's habit of mind to the machine shop.
Imiyalelo
Read the claim before you build
Read the claim before you build
Logan claims amplification. Write down the difference between measuring a size and measuring a deviation — the two need different instruments.
Handle a real indicator
Handle a real indicator
Press the plunger of the dial indicator gently and watch the needle. Estimate how many times larger the needle's travel is than the plunger's.
Amathuluzi adingekayo:
 Isikhombisi Se-dial
Build a lever amplifier
Build a lever amplifier
Cut a 200 mm card strip. Pin it to the board 20 mm from one end with a screw. The long end now moves nine times as far as the short end.
Izinto zokwakha zalesi sinyathelo:
 Iphepha Lamagridi1 ishidi
 Isikulufo somshini #6-321 ucezu
Amathuluzi adingekayo:
 Isikelo
Calculate your amplification ratio
Calculate your amplification ratio
Ratio = long arm divided by short arm. Write it down before you test it, then check it.
Izinto zokwakha zalesi sinyathelo:
Iphepha Lamagridi1 ishidiAmathuluzi adingekayo:
 Irula
IrulaFeed a known input with a feeler leaf
Feed a known input with a feeler leaf
Slide a 0.05 mm feeler leaf under the short end. Measure how far the long end rises.
Amathuluzi adingekayo:
 Isethi yezilinganiso zesikhalaIrula
Check measured against predicted
Check measured against predicted
Compare the measured rise with ratio × 0.05 mm. Any shortfall is lost motion in your pivot — the enemy Logan's gearing had to defeat.
Izinto zokwakha zalesi sinyathelo:
Iphepha Lamagridi1 ishidiBuild a scale for the long end
Build a scale for the long end
Mark a card scale where the long end sweeps, graduated in millimetres. Each millimetre now stands for a fraction of one at the input.
Izinto zokwakha zalesi sinyathelo:
Iphepha Lamagridi1 ishidiAmathuluzi adingekayo:
Irula Ipeni Elingesulekiyo
Measure the whole feeler set
Measure the whole feeler set
Run every leaf from 0.05 to 0.50 mm through your amplifier, recording the output each time.
Izinto zokwakha zalesi sinyathelo:
Iphepha Lamagridi1 ishidiAmathuluzi adingekayo:
Isethi yezilinganiso zesikhalaPlot input against output
Plot input against output
Plot the pairs. A good instrument gives a straight line. Curvature means your ratio changes with position — a real and common defect.
Izinto zokwakha zalesi sinyathelo:
Iphepha Lamagridi1 ishidiFind the backlash
Find the backlash
Approach one leaf thickness from below, then from above. The two readings differ. That gap is backlash, and it is why indicators are read in one direction only.
Amathuluzi adingekayo:
Isethi yezilinganiso zesikhalaMeasure flatness with the real indicator
Measure flatness with the real indicator
Rest the indicator on the surface plate and sweep it across the board's face. Watch the needle wander. You are seeing the board's error, magnified.
Izinto zokwakha zalesi sinyathelo:
 Ipulangwe Lokhuni Eliyisicaba1 ucezu
Amathuluzi adingekayo:
Isikhombisi Se-dial Ipuleti lobuso
Measure run-out on a rod
Measure run-out on a rod
Roll the brass rod under the indicator tip. The needle sweep is the rod's out-of-roundness — invisible to the eye, obvious to the dial.
Amathuluzi adingekayo:
Isikhombisi Se-dial Ubhamu Lwethusi
Try the same job with a micrometer
Try the same job with a micrometer
Attempt step 11 with the micrometer instead. It is slow and awkward, because it answers the wrong question. Two instruments, two jobs.
Amathuluzi adingekayo:
 I-Micrometer
History & Context
History & Context
US 283,627, “Improvement in Gages”, John Logan of Waltham, Massachusetts, filed 15 May 1883, granted 21 August 1883.
A date correction. Several respectable secondary sources give this patent as 21 August 1886. The patent document itself is dated 1883, and the number is consistent with 1883 issues. Where a secondary source and the document disagree, the document wins.
What happened to it. Frank Randall, a watchmaker at the E. Howard Watch Company, bought Logan's patent rights in 1896 and went into partnership with Francis Stickney; Randall & Stickney of Waltham then manufactured dial indicators for general industry. The rack-and-pinion arrangement Logan developed is still the mechanism inside most mechanical dial indicators.
Why deviation matters more than size. On a production line nobody re-measures every dimension of every part. They set a master, zero an indicator against it, and then read only the difference for every part after. Reading a difference is faster, needs less skill, and is less error-prone than reading an absolute size — which is what let unskilled operators hold skilled tolerances. The gauge blocks and the comparator later in this batch are both built on the same insight.
Izinto
3- 1 ishidiIsibambeli
- 1 ucezuIsibambeli
- Isibambeli
Izinto Zokwakha Ze-Blueprint Exhunyiwe

Ama-blueprint ahlobene
Lama-blueprint abelana ngolwazi — amasu, izinto noma izimiso

CC0 Isizinda Somphakathi
Le blueprint ikhishwe ngaphansi kwe-CC0. Ukhululekile ukukopisha, ukuguqula, ukusabalalisa, nokusebenzisa ngaphandle kwemvume.
Sekela uMenzi ngokuthenga imikhiqizo nge-Blueprint yabo IKhomishane Yomenzi kumiswe ngabathengisi, noma dala inguqulo entsha yale Blueprint bese uyifaka njengoxhumaniso ku-Blueprint yakho ukuze wabelane ngemali engenayo.