ARTE
BELEZA E BEM-ESTAR
ARTESANATO
CULTURA E HISTÓRIA
ENTRETENIMENTO
MEIO AMBIENTE
COMIDA E BEBIDAS
ENGENHARIA REVERSA
CIÊNCIAS
ESPORTES
TECNOLOGIA
TECNOLOGIA VESTÍVEL
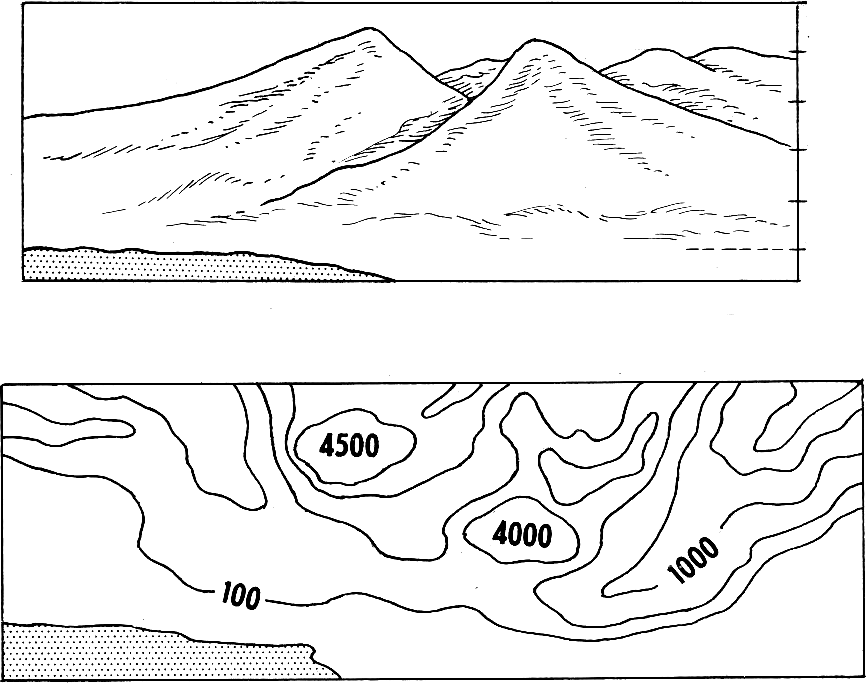


Contouring: Drawing the Shape of the Ground
A traverse gives you the outline of a site. Levelling gives you the height of the points you happened to stand on. Neither tells you the SHAPE of the ground between them — which is what you need to know where water will go, where a building will need cut and fill, and whether a path can be walked.
A contour is a line joining points of equal height. Nobody surveys contours directly; you level a grid of spot heights and then work out where each contour must cross between them, by proportion. The map that results is the single most information-dense drawing in surveying: slope, drainage, volume and visibility are all readable from it.
It is also the rung that makes the water blueprints buildable. A constructed wetland or a drainage run needs to know which way the ground falls, and by how much.
Intermediário
2 days
Instruções
1
1
Lay out a grid over the area
Lay out a grid over the area
Set out a square grid of pegs — 5, 10 or 20 metres depending on how broken the ground is — using the right-angle method and a tape. Letter one axis and number the other, so every peg has a name like C4.
Choose the spacing from the SMALLEST feature you care about, not from how much walking you are willing to do. A 20-metre grid cannot see a 5-metre gully, and no amount of careful levelling at the pegs will put it back. The grid is a sampling decision, and it is made before any measurement.
Materiais para este passo:
 Cavilhas de madeira40 peças
Ferramentas necessárias:
 Fita métrica
 Martelo de unha
 Fio de prumada
 Kit de bandeirolas e estacas de topografia
2
2
Level every grid point from as few setups as possible
Level every grid point from as few setups as possible
Set the instrument where it can see the most pegs, take a backsight to your benchmark, then read the staff at every visible peg as an intermediate sight.
Intermediate sights are cheap — one instrument setup can produce twenty heights — but they carry no check at all, because nothing closes on them. So move between setups on a proper backsight-and-foresight change point, and close the whole run back to the benchmark at the end. Speed on the intermediates, rigour on the change points.
Ferramentas necessárias:
 Nível óptico (topografia)
 Mira de nivelamento
 Tripé de câmara
3
3
Write the heights on the plan, at the pegs
Write the heights on the plan, at the pegs
Plot the grid to scale and write each reduced level beside its peg, to the nearest 10 millimetres.
Write them small and consistently placed — always above-right of the point, for example — because you are about to draw lines through this drawing and it must stay readable. Do not round to the nearest 100 millimetres to tidy it up: the interpolation in the next step needs the real figures, and a rounded grid produces contours with false steps in them.
Materiais para este passo:
 Papel milimétrico10 peças
Ferramentas necessárias:
 Régua
4
4
Interpolate the contour crossings
Interpolate the contour crossings
Between every adjacent pair of pegs, work out where each whole contour value falls, assuming the ground runs straight between them. Mark each crossing with a tick.
The assumption of a straight slope between pegs is exactly that — an assumption, and the only one available. It is why the grid spacing chosen in step 1 governs everything: between two pegs your map is not a measurement, it is a straight line you decided to believe in.
Ferramentas necessárias:
Régua5
5
Join the ticks, and obey the rules contours cannot break
Join the ticks, and obey the rules contours cannot break
Draw smooth lines through ticks of the same value. Then check them against the rules: contours never cross, never split, never simply stop inside the map, and close on themselves or run off the edge.
They also point UPSTREAM in a valley, forming a V that aims uphill — which is the quickest way to read drainage off a map and the quickest way to spot that you have drawn one backwards. Every one of those rules follows from a contour being a level line on a continuous surface, and a drawing that breaks one has a mistake in it, not an unusual landscape.
6
6
Interpolation, interval and what the map can tell you
Interpolation, interval and what the map can tell you
A carregar o notebook Jupyter…
Ferramentas necessárias:
RéguaMateriais
2- 40 peçasReferência
- 10 peçasReferência
Ferramentas necessárias
8- 1 vendor sell this, none ship to you yetReferência
- Referência
- Referência
- Referência
- Referência
- Referência
- Referência
Blueprints relacionados
Estes blueprints compartilham conhecimento — técnicas, materiais ou princípios


CC0 Domínio Público
Este blueprint é liberado sob CC0. Você é livre para copiar, modificar, distribuir e usar este trabalho para qualquer finalidade, sem pedir permissão.
Apoie o Maker comprando produtos através do Blueprint, onde ele ganha uma Comissão Maker definida pelos vendedores, ou crie uma nova versão deste Blueprint e inclua-o como conexão no seu próprio Blueprint para compartilhar receita.