ARTE
BELEZA E BEM-ESTAR
ARTESANATO
CULTURA E HISTÓRIA
ENTRETENIMENTO
MEIO AMBIENTE
COMIDA E BEBIDAS
ENGENHARIA REVERSA
CIÊNCIAS
ESPORTES
TECNOLOGIA
TECNOLOGIA VESTÍVEL
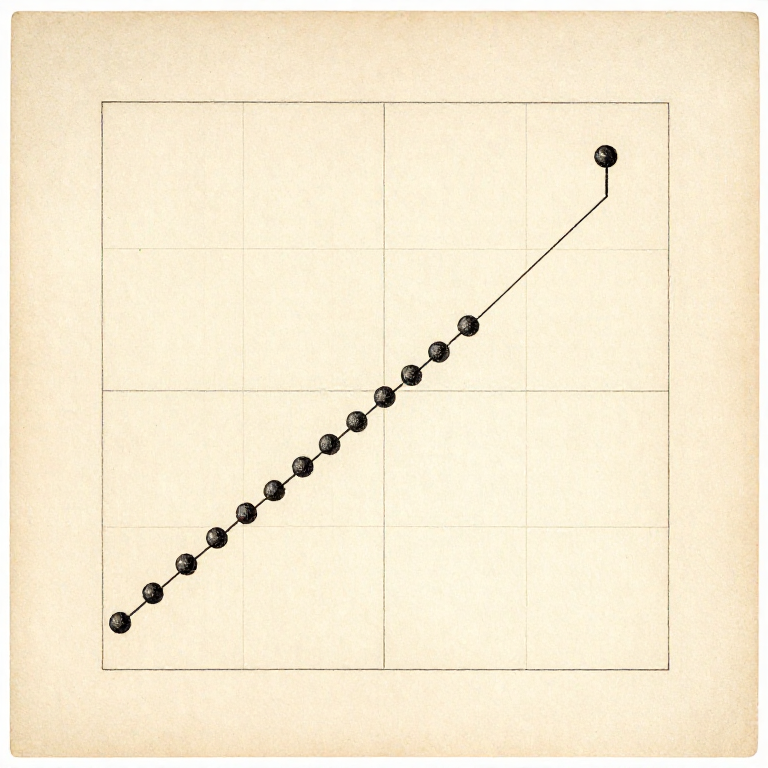


Plot It Before You Conclude: What a Table of Numbers Hides
Summary statistics are a compression, and like any compression they throw information away. A mean, a spread and a trend line can be identical for data that behaves in completely different ways — and the difference is obvious the moment you draw it.
This is not a hypothetical worry. Frank Anscombe published four small datasets in 1973 that share their mean, their variance, their correlation and their fitted line to two decimal places, and look nothing whatever like each other on paper.
So the rule is: plot it FIRST, before computing anything. The plot takes a minute, it cannot be fooled the way a summary can, and it is the only step that reliably catches a single bad point, a curve you assumed was a line, or a group that should never have been averaged together.
Intermediário
3 hours
Instruções
1
1
Four datasets, one set of statistics
Four datasets, one set of statistics
A carregar o notebook Jupyter…
Ferramentas necessárias:
 Computador de secretária
 Papel milimétrico
2
2
Plot the raw points, not the averages
Plot the raw points, not the averages
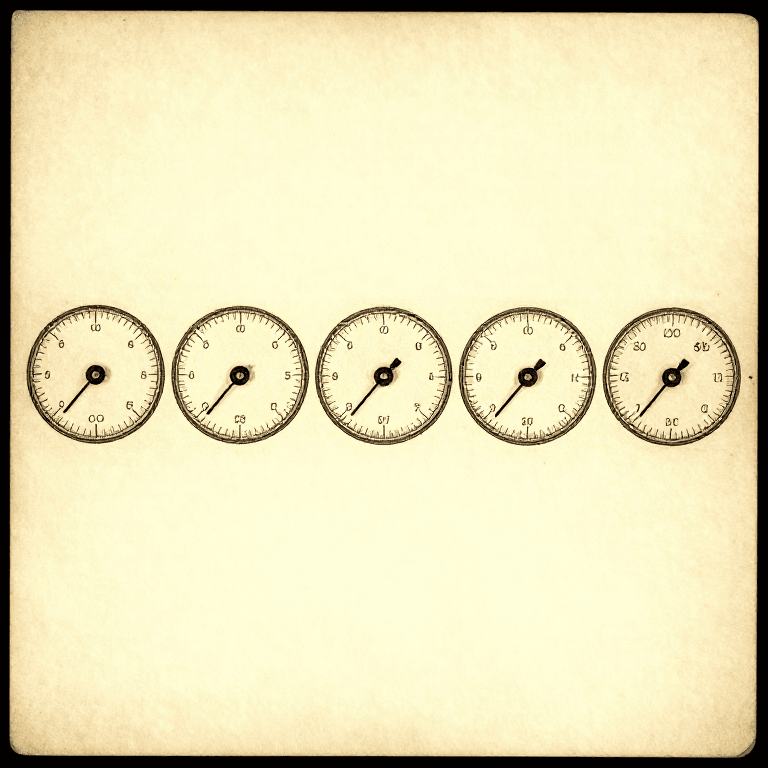
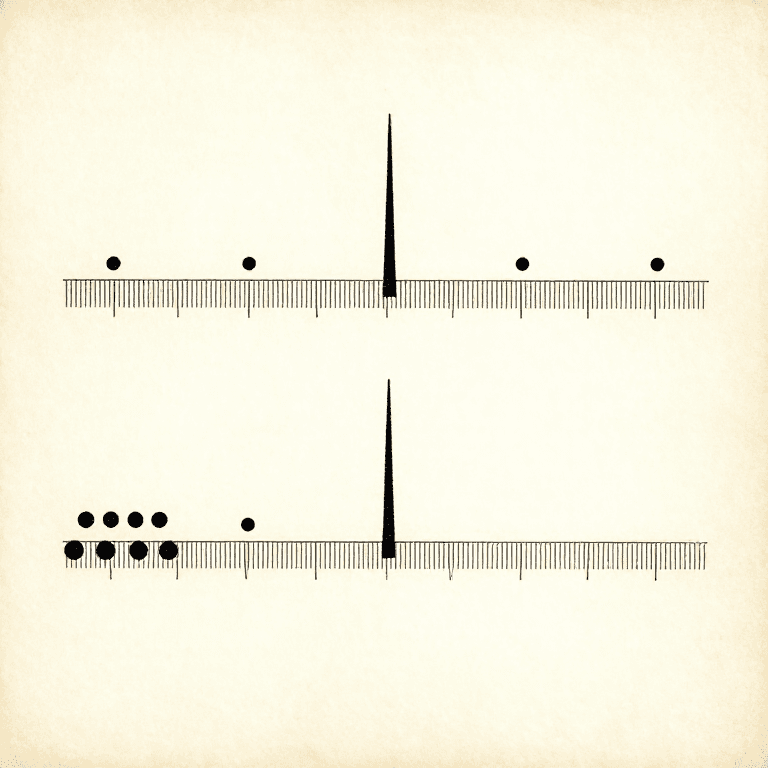
Plot every reading you took, not one mean per condition. Six repeats plotted as six dots show their spread, their drift through the session and any outlier; collapsed to one dot they show none of it.
If you must plot means, draw the spread on them as error bars. A plot of bare means invites the eye to join them into a trend, and the eye will do it even when the bars overlap completely — which is the graphical version of calling a difference smaller than the scatter an effect.
Plot in the ORDER you took them too, as a second graph against run number. That one plot catches every drift: a warming room, a battery going flat, a blade dulling, an operator getting better at the job.
Ferramentas necessárias:
Papel milimétrico Régua
Régua3
3
Choose the axes so a straight line means something
Choose the axes so a straight line means something
A curve is hard to judge by eye; a straight line is easy. So if theory says the period goes as the square root of the length, plot period against the square root of length rather than against length, and the relationship becomes a line you can check with a ruler.
The same trick handles growth and decay: plot the logarithm, and an exponential becomes a straight line whose slope is the rate. Quantities spanning several powers of ten almost always want a log axis, because otherwise every small value is crushed against the bottom.
Start the axes at zero unless you have a reason not to, and say so when you do not. A truncated axis makes a 2% difference look enormous, and that is the commonest way an honest plot misleads an honest reader.
Ferramentas necessárias:
Papel milimétrico CalculadoraRégua
4
4
Plot as you go, not at the end
Plot as you go, not at the end
Draw the points onto the graph while you are still taking them. A plot growing in front of you shows a problem while the apparatus is still set up and the sample still exists.
It also tells you where to spend the remaining time. Points crowding into one corner with a gap in the middle means the next few readings should go in the gap; a curve appearing where you expected a line means taking more points at the ends before packing up.
Graph paper in the notebook is enough. A hand-drawn plot made during the experiment is worth more than a beautiful one made a week later from numbers that can no longer be questioned.
Ferramentas necessárias:
Papel milimétricoBlueprints relacionados
Estes blueprints compartilham conhecimento — técnicas, materiais ou princípios

CC0 Domínio Público
Este blueprint é liberado sob CC0. Você é livre para copiar, modificar, distribuir e usar este trabalho para qualquer finalidade, sem pedir permissão.
Apoie o Maker comprando produtos através do Blueprint, onde ele ganha uma Comissão Maker definida pelos vendedores, ou crie uma nova versão deste Blueprint e inclua-o como conexão no seu próprio Blueprint para compartilhar receita.