LIST
FEGURÐ OG VELLÍÐAN
HANDVERK
MENNING OG SAGA
SKEMMTUN
UMHVERFI
MATUR OG DRYKKUR
ÖFUGVERKFRÆÐI
VÍSINDI
ÍÞRÓTTIR
TÆKNI
KLÆÐANLEG TÆKNI
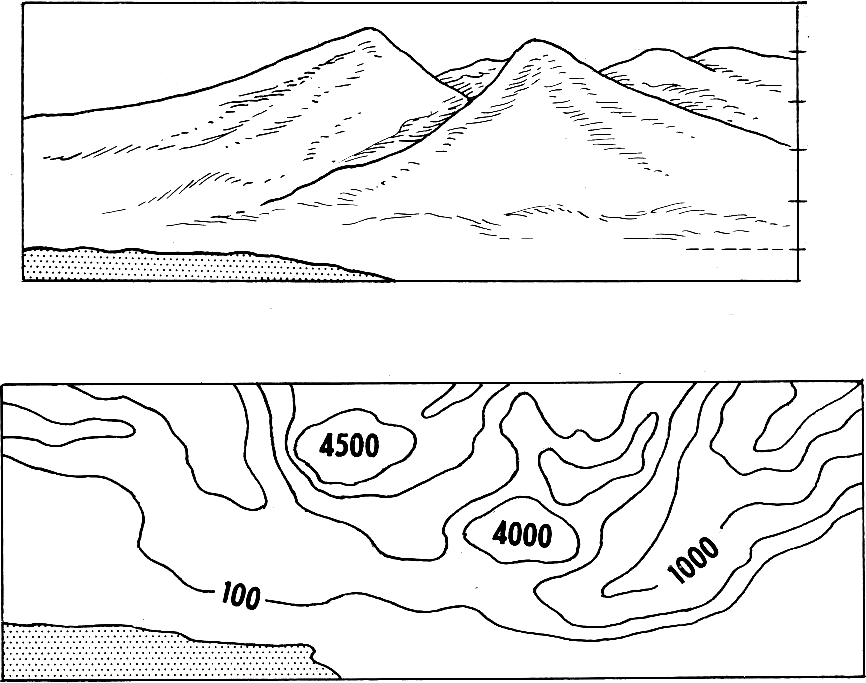


Contouring: Drawing the Shape of the Ground
A traverse gives you the outline of a site. Levelling gives you the height of the points you happened to stand on. Neither tells you the SHAPE of the ground between them — which is what you need to know where water will go, where a building will need cut and fill, and whether a path can be walked.
A contour is a line joining points of equal height. Nobody surveys contours directly; you level a grid of spot heights and then work out where each contour must cross between them, by proportion. The map that results is the single most information-dense drawing in surveying: slope, drainage, volume and visibility are all readable from it.
It is also the rung that makes the water blueprints buildable. A constructed wetland or a drainage run needs to know which way the ground falls, and by how much.
Miðlungs
2 days
Leiðbeiningar
1
1
Lay out a grid over the area
Lay out a grid over the area
Set out a square grid of pegs — 5, 10 or 20 metres depending on how broken the ground is — using the right-angle method and a tape. Letter one axis and number the other, so every peg has a name like C4.
Choose the spacing from the SMALLEST feature you care about, not from how much walking you are willing to do. A 20-metre grid cannot see a 5-metre gully, and no amount of careful levelling at the pegs will put it back. The grid is a sampling decision, and it is made before any measurement.
Efni fyrir þetta skref:
 Trétappar40 stykki
Nauðsynleg verkfæri:
 Málband
 Klóhamar
 Mælisnúra
 Sett af mælingarflöggum og -pinnum
2
2
Level every grid point from as few setups as possible
Level every grid point from as few setups as possible
Set the instrument where it can see the most pegs, take a backsight to your benchmark, then read the staff at every visible peg as an intermediate sight.
Intermediate sights are cheap — one instrument setup can produce twenty heights — but they carry no check at all, because nothing closes on them. So move between setups on a proper backsight-and-foresight change point, and close the whole run back to the benchmark at the end. Speed on the intermediates, rigour on the change points.
Nauðsynleg verkfæri:
 Sjónhallamælir (landmælingar)
 Hæðarstöng
 Myndavélaþrífótur
3
3
Write the heights on the plan, at the pegs
Write the heights on the plan, at the pegs
Plot the grid to scale and write each reduced level beside its peg, to the nearest 10 millimetres.
Write them small and consistently placed — always above-right of the point, for example — because you are about to draw lines through this drawing and it must stay readable. Do not round to the nearest 100 millimetres to tidy it up: the interpolation in the next step needs the real figures, and a rounded grid produces contours with false steps in them.
Efni fyrir þetta skref:
 Rúðustrikaður pappír10 stykki
Nauðsynleg verkfæri:
 Reglustika
4
4
Interpolate the contour crossings
Interpolate the contour crossings
Between every adjacent pair of pegs, work out where each whole contour value falls, assuming the ground runs straight between them. Mark each crossing with a tick.
The assumption of a straight slope between pegs is exactly that — an assumption, and the only one available. It is why the grid spacing chosen in step 1 governs everything: between two pegs your map is not a measurement, it is a straight line you decided to believe in.
Nauðsynleg verkfæri:
Reglustika5
5
Join the ticks, and obey the rules contours cannot break
Join the ticks, and obey the rules contours cannot break
Draw smooth lines through ticks of the same value. Then check them against the rules: contours never cross, never split, never simply stop inside the map, and close on themselves or run off the edge.
They also point UPSTREAM in a valley, forming a V that aims uphill — which is the quickest way to read drainage off a map and the quickest way to spot that you have drawn one backwards. Every one of those rules follows from a contour being a level line on a continuous surface, and a drawing that breaks one has a mistake in it, not an unusual landscape.
6
6
Interpolation, interval and what the map can tell you
Interpolation, interval and what the map can tell you
Hleð Jupyter-vinnubók…
Nauðsynleg verkfæri:
ReglustikaNauðsynleg verkfæri
8- Staðgengill
- Staðgengill
- Staðgengill
- Staðgengill
- Staðgengill
- Staðgengill
- Staðgengill
Tengd Blueprint
Þessi blueprint deila þekkingu — tækni, efni eða meginreglur




CC0 opinbert ríki
Þessi teikning er gefin út undir CC0. Þér er frjálst að afrita, breyta, dreifa og nota þetta verk í hvaða tilgangi sem er, án þess að biðja um leyfi.
Studdu smiðinn með því að kaupa vörur í gegnum teikningu hans þar sem hann fær þóknun smiða sem seljendur ákvarða, eða búðu til nýja endurskoðun á þessari teikningu og tengdu hana sem tengingu í þinni eigin teikningu til að deila tekjum.