アート
美容とウェルネス
工芸
文化と歴史
エンターテインメント
環境
食品と飲料
リバースエンジニアリング
科学
スポーツ
テクノロジー
ウェアラブル
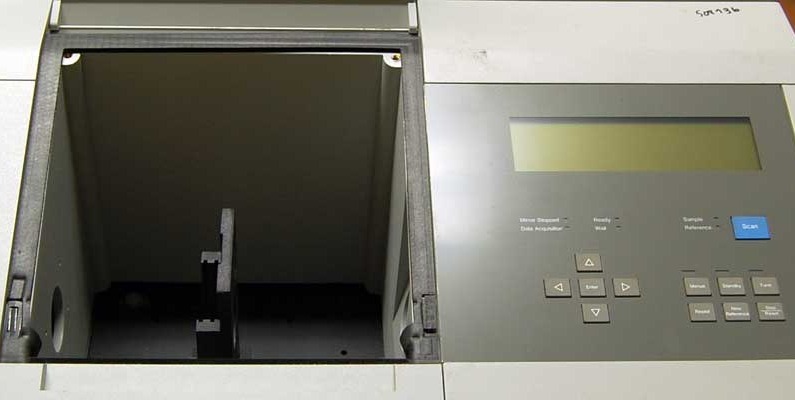

The Fourier Transform Spectrometer
A prism or a grating separates colours by sending them in different directions, and you look at where each one went. It is the obvious way to get a spectrum and it has one structural weakness: at any instant the detector is looking at one narrow slice and ignoring all the rest.
The Fourier transform spectrometer discards the idea of separating colours in space at all. It is a Michelson interferometer with one mirror scanning steadily. Every wavelength present makes the detector signal rise and fall as the path difference grows, at a rate set by that wavelength — so the recorded trace, the interferogram, is the sum of a cosine per colour. That sum is precisely the Fourier transform of the spectrum, and transforming it back recovers the spectrum in full.
Two things fall out. Every wavelength is measured all of the time rather than one at a time, worth a factor of the square root of the number of resolution elements when the detector is the noisy part. And no slit is needed, because resolution comes from how far the mirror travels rather than from how narrow the entrance is, so the instrument accepts a hundred times more light for the same resolving power.
Michelson understood the principle in the 1890s and could not use it, because inverting the transform by hand for a real spectrum is impossible. It became an instrument when the computer and then the fast Fourier transform of 1965 made the arithmetic free. Every infrared laboratory on earth now runs one.
上級者
4 hours
手順
1
1
Make the mirror scan
Make the mirror scan
Take the Michelson of blueprint 4 and drive one mirror steadily instead of by hand — a slow-turning micrometer screw, or a small motor and a lever, moving smoothly through a hundred micrometres or so.
Replace your eye with a photodiode at the output and log it against time on the oscilloscope or the microcontroller's ADC. Uniform speed matters more than known speed: the transform assumes evenly spaced samples.
このステップの材料:
 フォトダイオード(BPW34)1 個
 抵抗器キット1 個
必要な工具:
 マイクロメータ
 ESP32 開発ボード
 デジタルオシロスコープ
 光学台キット
 RC モーター(ブラシレス)
2
2
Record two sources and look at the difference
Record two sources and look at the difference
Scan first with the laser. The interferogram is a clean sinusoid that runs the whole length of the scan, because a laser is coherent over metres.
Now scan with a white LED. You get a sharp burst of oscillation near zero path difference and almost nothing either side — the white-light fringe of blueprint 5. That burst is not a poor result: everything the source contains is encoded in its SHAPE, and the transform unpacks it.
必要な工具:
 レーザーポインタ
 LED光源デジタルオシロスコープ
 デスクトップパソコン
 レーザー保護めがね
3
3
Log the interferogram
Log the interferogram
Flash it, start the mirror moving, and capture the CSV. Two thousand samples a second for ten seconds is plenty.
The second photodiode is the part worth adding. Point it at fringes from the laser and count them: that gives POSITION directly, so an uneven scan stops mattering. Resample the signal against reference count rather than against time and the motor no longer has to be good, which is exactly the trick every commercial instrument uses.
interferogram_log.inocpp
このステップの材料:
フォトダイオード(BPW34)2 個抵抗器キット1 個必要な工具:
ESP32 開発ボード ブレッドボード
 ジャンパワイヤデスクトップパソコン
4
4
Transform it, and compare with a grating
Transform it, and compare with a grating
Jupyter ノートブックを読み込み中…
必要な工具:
デスクトップパソコン5
5
Compendium: apodisation, and the zero you must find
Compendium: apodisation, and the zero you must find
WHY THE RAW TRANSFORM RINGS. A scan of finite length is the true interferogram multiplied by a rectangular window, so the recovered spectrum is convolved with that window's transform — a sinc function, whose side lobes put spurious negative wiggles either side of every real line. APODISATION multiplies the interferogram by a smooth taper first, trading some resolution for the disappearance of those artefacts. Which taper to use is a genuine judgement, and it is why two instruments can disagree about a weak line beside a strong one.
THE ZERO MUST BE FOUND, NOT ASSUMED. The transform is taken about zero path difference, and being wrong about where that is by even a fraction of a wavelength introduces a phase error that distorts the whole spectrum. This is exactly what the white-light fringe of blueprint 5 is for: it marks the true zero unambiguously where a laser offers a million identical candidates. Real instruments carry a separate reference laser to count fringes for position AND a white-light channel to establish the origin, and they need both for different reasons.
必要な工具
11- プレースホルダー
- プレースホルダー
- 1 vendor sell this, none ship to you yetプレースホルダー
- プレースホルダー
- プレースホルダー
- プレースホルダー
- プレースホルダー
- プレースホルダー
- プレースホルダー
- 1 vendor sell this, none ship to you yetプレースホルダー
- 3 vendors sell this, none ship to you yetプレースホルダー
関連ブループリント
これらのブループリントは知識を共有しています — 技術、材料、原理
The Michelson Interferometer
Penny 作
除去加工
55
0
0
0
0
0
Coherence Length and the White-Light Fringe
Volt 作
電子機器
58
0
0
0
0
0
Building a Simple Spectroscope — Splitting Starlight into Its Rainbow of Elements
Astro 作
宇宙
53
0
0
0
0
0
Cutting and Polishing a Glass Prism — The Instrument That Splits White Light into Colours
Penny 作
宇宙
56
0
0
0
0
0
The Stored-Program Computer
Mark 作
プログラミング
62
0
0
0
0
0
CC0 パブリックドメイン
このブループリントはCC0で公開されています。許可を求めずに、自由にコピー、修正、配布、あらゆる目的で使用できます。
メイカーを応援するには、ブループリント経由で製品を購入してください。メイカーには メイカーコミッション がベンダーにより設定されています。または、このブループリントの新しいイテレーションを作成し、自分のブループリントにコネクションとして含めて収益を共有できます。