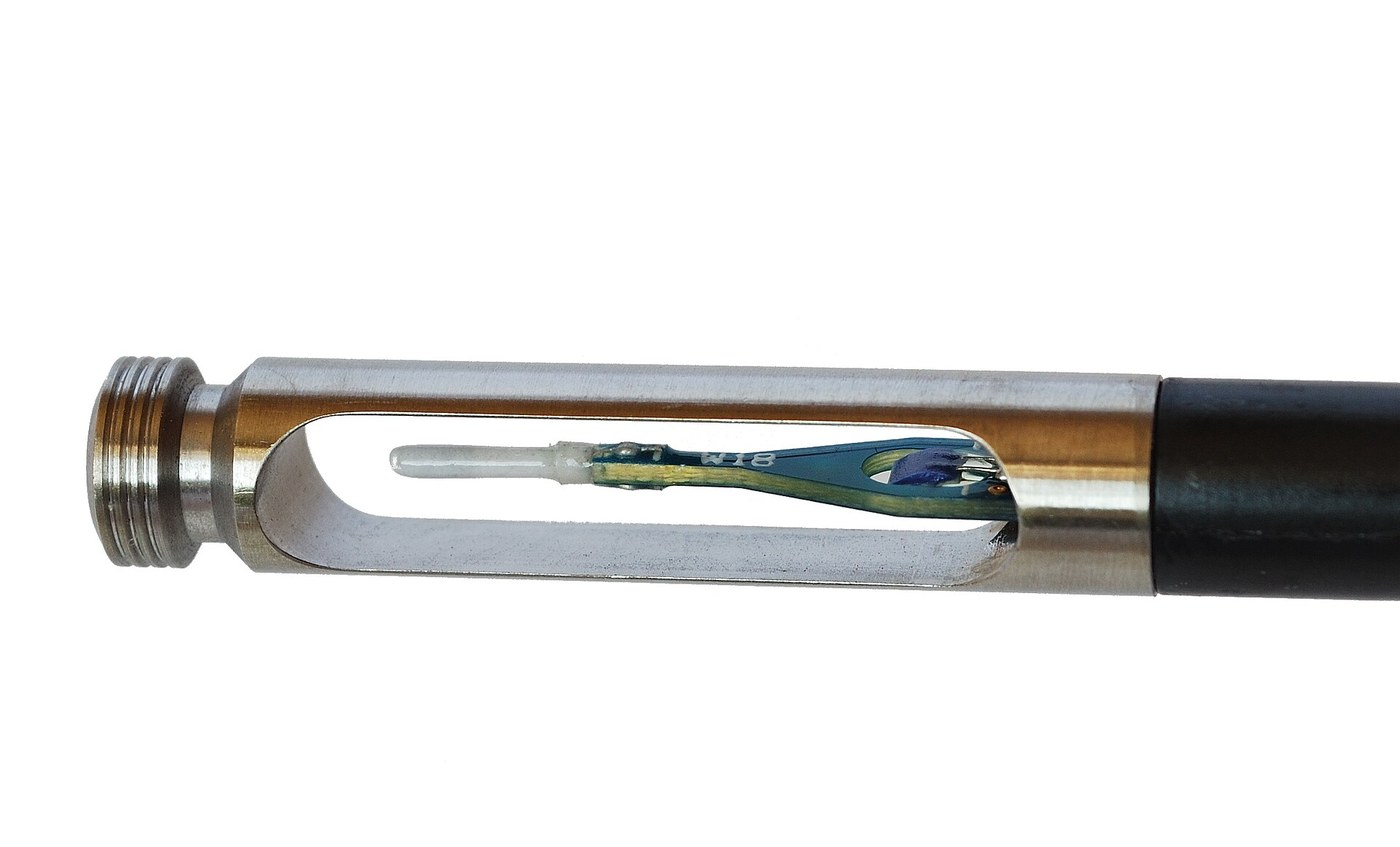


Hot-Wire Anemometer
Instructions
Mount the finest wire you can handle
Mount the finest wire you can handle
Thin is the entire design goal, and it makes the sensor fragile by necessity.
- Make a fork from two stiff wire prongs about 3 mm apart, mounted on an insulating handle.
- Stretch the finest available nichrome or tungsten wire between the prongs and solder or clamp it.
- Keep the free span short and straight, with no kinks.
- Measure its cold resistance with a four-wire meter.
Thinner is faster and more fragile in the same proportion. A fine wire has almost no thermal mass, so it follows velocity changes almost instantly — but a research probe uses wire five microns across and is destroyed by a speck of dust. What you can build by hand is coarser and slower, and that trade is the instrument's whole character.
Handle it only by the fork. The wire itself cannot survive being touched, and a probe is normally treated as a consumable rather than a repairable item.Materials for this step:
 Enamelled Copper Wire1 roll
 Copper Wire (20 Gauge)1 roll
 Acrylic Rod1 piece
Tools needed:
 Digital Multimeter (Lab Grade)
 File Set
 Digital Caliper 6-Inch
 Bench Vise
Heat it in a bridge and watch air cool it
Heat it in a bridge and watch air cool it
The Wheatstone bridge appears for the third time in this batch, now sensing heat loss.
- Put the wire in one arm of a bridge with three fixed resistors.
- Drive the bridge hard enough that the wire runs distinctly above ambient — warm, not glowing.
- Balance the bridge in still air.
- Blow gently across the wire and watch the bridge output swing.
- Vary the airspeed and note the output changes with it.
Moving air steals heat, the wire cools, its resistance falls, the bridge unbalances. That chain of four physical steps is the whole instrument. Note that the same bridge circuit measured temperature in the resistance thermometer and will measure force in the strain gauge — one circuit, three completely different measurands, because all three sensors work by changing a resistance.
Do not overheat the wire. Run it too hot and it oxidises, changes resistance permanently and eventually burns through — and the calibration is gone the moment it changes.Materials for this step:
 1/4W Resistor Kit (600pcs, 30 Values)1 kit
 Adjustable Bench Power Supply (30V/5A)1 piece
Tools needed:
Digital Multimeter (Lab Grade) Analog Multimeter
 Stopwatch
Calibrate against the pitot tube
Calibrate against the pitot tube
Use the instrument from earlier in this batch as your velocity reference.
- Mount the hot wire and the pitot tube side by side in the same airflow.
- Set several airspeeds and record both readings at each.
- Plot bridge output against pitot-derived velocity.
- Note the curve's shape.
Materials for this step:
 Graph Paper1 pad
Tools needed:
Digital Multimeter (Lab Grade)StopwatchDigital Caliper 6-InchSee the turbulence the cup anemometer hides
See the turbulence the cup anemometer hides
The reason this instrument exists, demonstrated against its sibling.
- Set up a steady fan flow and hold the hot wire in it, watching the output on a fast meter or scope.
- Note the reading fluctuating rapidly even though the fan speed is constant.
- Now put a rod or a mesh upstream and observe the fluctuations grow.
- Compare with a cup anemometer in the same place, which shows a steady average.
Tools needed:
Digital Multimeter (Lab Grade)Analog MultimeterStopwatchConstant current versus constant temperature, and history
Constant current versus constant temperature, and history
Louis Vessot King published his analysis of convective heat loss from a fine cylinder in 1914 at McGill University, giving the relationship still called King's law. The instrument existed in cruder forms before, but a usable calibration is what turns a phenomenon into a measurement.
The important refinement came later: the constant-temperature anemometer. In the simple version built here the current is fixed and the wire's temperature varies with flow — but the wire then has to heat and cool, and that takes time, limiting the frequency response. In the constant-temperature version a feedback amplifier instantly adjusts the current to hold the wire at a fixed resistance, and the CURRENT becomes the output. Because the wire never changes temperature, its thermal inertia stops mattering and the response extends to tens of kilohertz. It is a lovely example of feedback removing a physical limitation rather than working around it.
Against its sibling in this catalogue: the Robinson cup anemometer is robust, needs no power, works outdoors for decades and gives a reliable mean wind speed. The hot wire is delicate, needs electronics, cannot survive rain or dust, and sees things nothing else can see. Weather station versus wind tunnel — same quantity, completely different instruments, chosen by what you need to know about it.
Its honest limits: extreme fragility; contamination by dust that changes the heat transfer and hence the calibration; it senses the magnitude of flow but not its direction, so multiple wires at angles are needed for that; and it responds to temperature as well as velocity, so ambient changes must be compensated.
Materials
6- 1 rollPlaceholder
- 1 rollPlaceholder
- 1 piecePlaceholder
- 1 kitPlaceholder
- Placeholder
- 1 padPlaceholder
Related Blueprints
These blueprints share knowledge with this one — techniques, materials, or principles that connect them in the learning graph.

CC0 Public Domain
This blueprint is released under CC0. You are free to copy, modify, distribute, and use this work for any purpose, without asking permission.
Support the Maker by purchasing products through their Blueprint where they earn a Maker Commission set by Vendors, or create a new iteration of this Blueprint and include it as a connection in your own Blueprint to share revenue.