
Building a Simple Spectroscope — Splitting Starlight into Its Rainbow of Elements
A spectroscope splits light into its component colours — its spectrum — revealing what elements produced the light. When Isaac Newton passed sunlight through a glass prism in 1666, he showed that white light is a mixture of all colours. In 1814, Joseph von Fraunhofer examined the Sun's spectrum more carefully and discovered dark lines crossing the rainbow — specific colours that were missing. Each element absorbs or emits light at precise wavelengths: hydrogen produces red, blue-green, blue-violet, and violet lines; sodium produces a bright yellow doublet; iron produces hundreds of fine lines. By matching these spectral fingerprints, astronomers can determine what stars are made of without ever visiting them — the birth of astrophysics. This blueprint builds a functional prism spectroscope from a glass prism and simple materials, capable of resolving the Fraunhofer lines in sunlight and the emission lines of common elements in flame tests.
Arahan
Understand how a prism works
Understand how a prism works
Make the slit
Make the slit
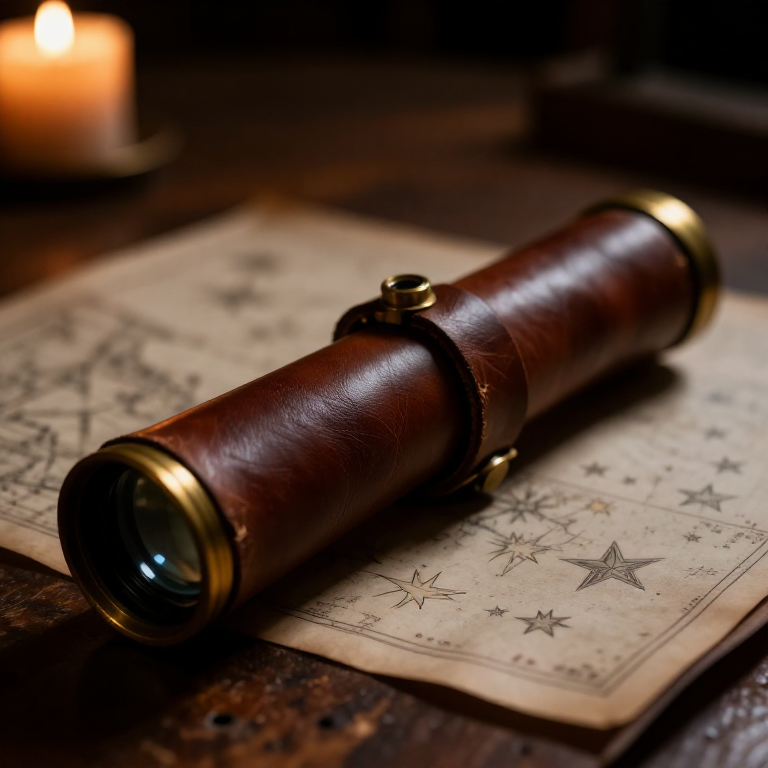
Mount the prism
Mount the prism
Bahan untuk langkah ini:
 Glass Prism1 keping
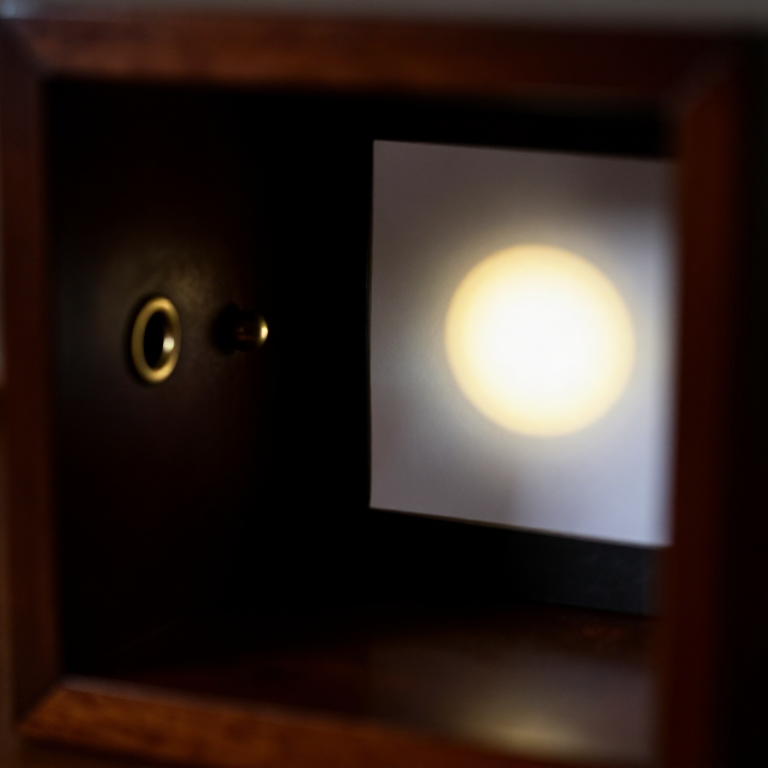
Build the light-tight enclosure
Build the light-tight enclosure
Add a collimating lens
Add a collimating lens
Bahan untuk langkah ini:
 Convex Lens1 keping
Observe the solar spectrum
Observe the solar spectrum
Observe emission spectra — sodium
Observe emission spectra — sodium
Observe other elements
Observe other elements
Calibrate with known wavelengths
Calibrate with known wavelengths
Observe the spectrum of a bright star
Observe the spectrum of a bright star
Bahan
2- 1 kepingPemegang Tempat
- 1 kepingPemegang Tempat
Bahan Blueprint Bersambung
Blueprint berkaitan
Blueprint ini berkongsi pengetahuan — teknik, bahan atau prinsip
Related blueprints
Other builds that share materials, tools, or techniques with this one.


CC0 Domain Awam
Blueprint ini dikeluarkan di bawah CC0. Anda bebas menyalin, mengubah, mengedar, dan menggunakan karya ini untuk sebarang tujuan, tanpa meminta kebenaran.
Sokong Pembuat dengan membeli produk melalui Blueprint mereka di mana mereka memperoleh Komisen Pembuat ditetapkan oleh Penjual, atau cipta iterasi baru Blueprint ini dan sertakan ia sebagai sambungan dalam Blueprint anda sendiri untuk berkongsi hasil.